Solar Buyer's Guide
Is Solar Worth It in 2026? Honest Payback Math for U.S. Homeowners
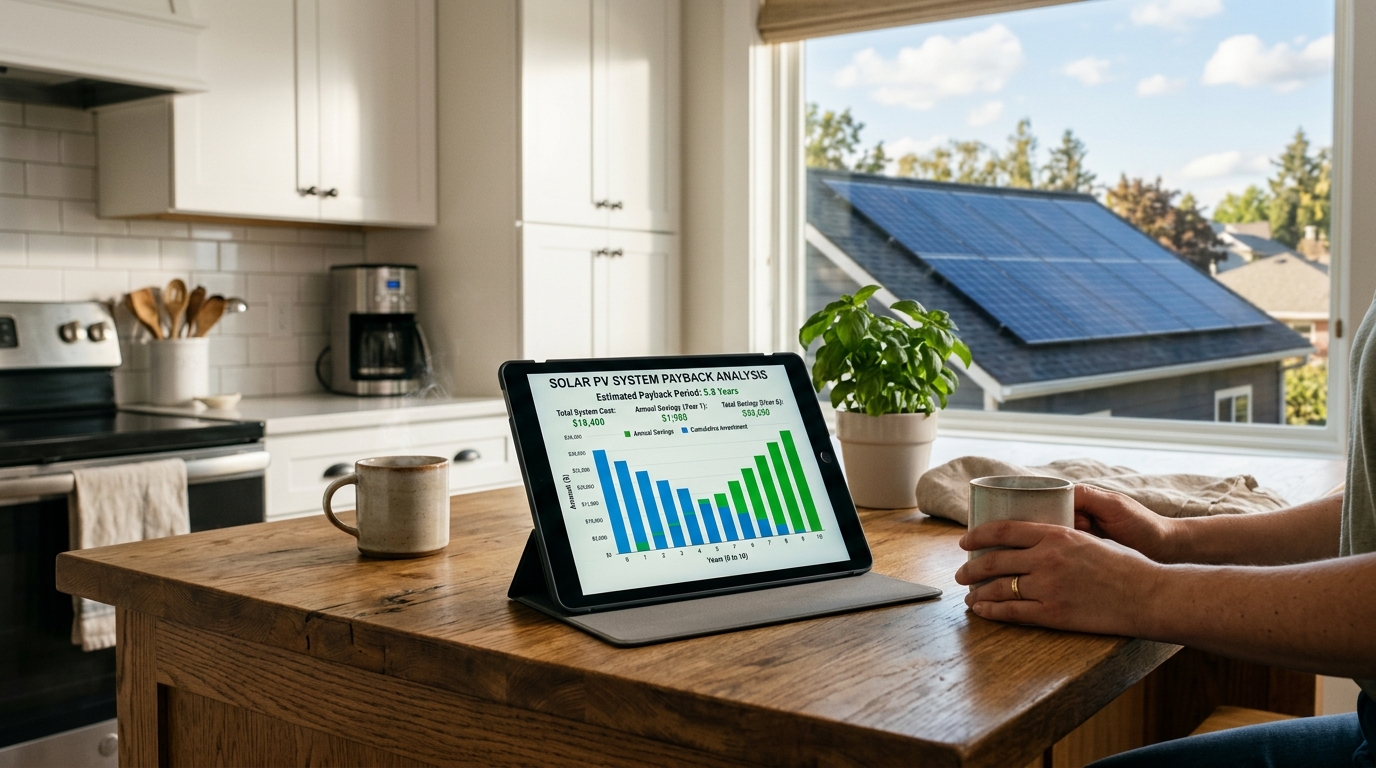
Residential solar still pencils out for most U.S. homeowners in 2026 — but the math has shifted meaningfully since the 2021–22 boom. Federal tax credits are still 30%. Panel prices are roughly flat. But utility net-metering programs have eroded in several states, and interest rates on solar loans have nearly doubled since 2021. Here's the honest payback math, by scenario, and where solar still clearly wins.
The 2026 baseline: typical install cost and savings
- Average system cost (gross): $22,000–$35,000 for a 10 kW system at mid-range quality
- Federal Residential Clean Energy Credit: 30% (in effect through 2032)
- Net cost after credit: ~$15,400–$24,500
- Typical first-year electricity savings: $1,400–$2,800 (depends on rate × consumption)
- Typical payback period (cash purchase): 7–11 years
- System lifespan: 25–30+ years with linear degradation (~0.5%/yr)
So the simplest framing: you pay $15–25k now, and in 7–11 years you've recouped that — leaving 15–20 years of essentially free electricity. That's powerful math when it works. It's also math that breaks if even one of the inputs goes wrong (low electric bill, no roof sun, finance at 9%+ instead of cash).
Where solar still clearly wins in 2026
- Hawaii. Electricity rates of $0.42/kWh (3× the national average) mean payback periods of 4–6 years. The single best solar economics in the U.S.
- California. $0.30–$0.40/kWh PG&E and SDG&E rates, plus NEM 3.0 making battery storage important — but bills are still high enough that 7–9 year payback is typical for owner-occupied panels + battery.
- Massachusetts, New York, New Jersey, Connecticut. Strong state-level incentives (SMART, NY-Sun, SREC programs) compound the federal 30% credit. 6–8 year payback even with moderate electric bills.
- Anywhere with $200+ monthly electric bills. The math is rate-driven. Above $200/mo you're almost always in payback-under-10-years territory.
- Cash buyers or HELOC at < 7%. Financing cost is the second-biggest variable after electric rates. Cash and cheap HELOCs make the payback math 1.5–3 years faster than 9–10% solar loans.
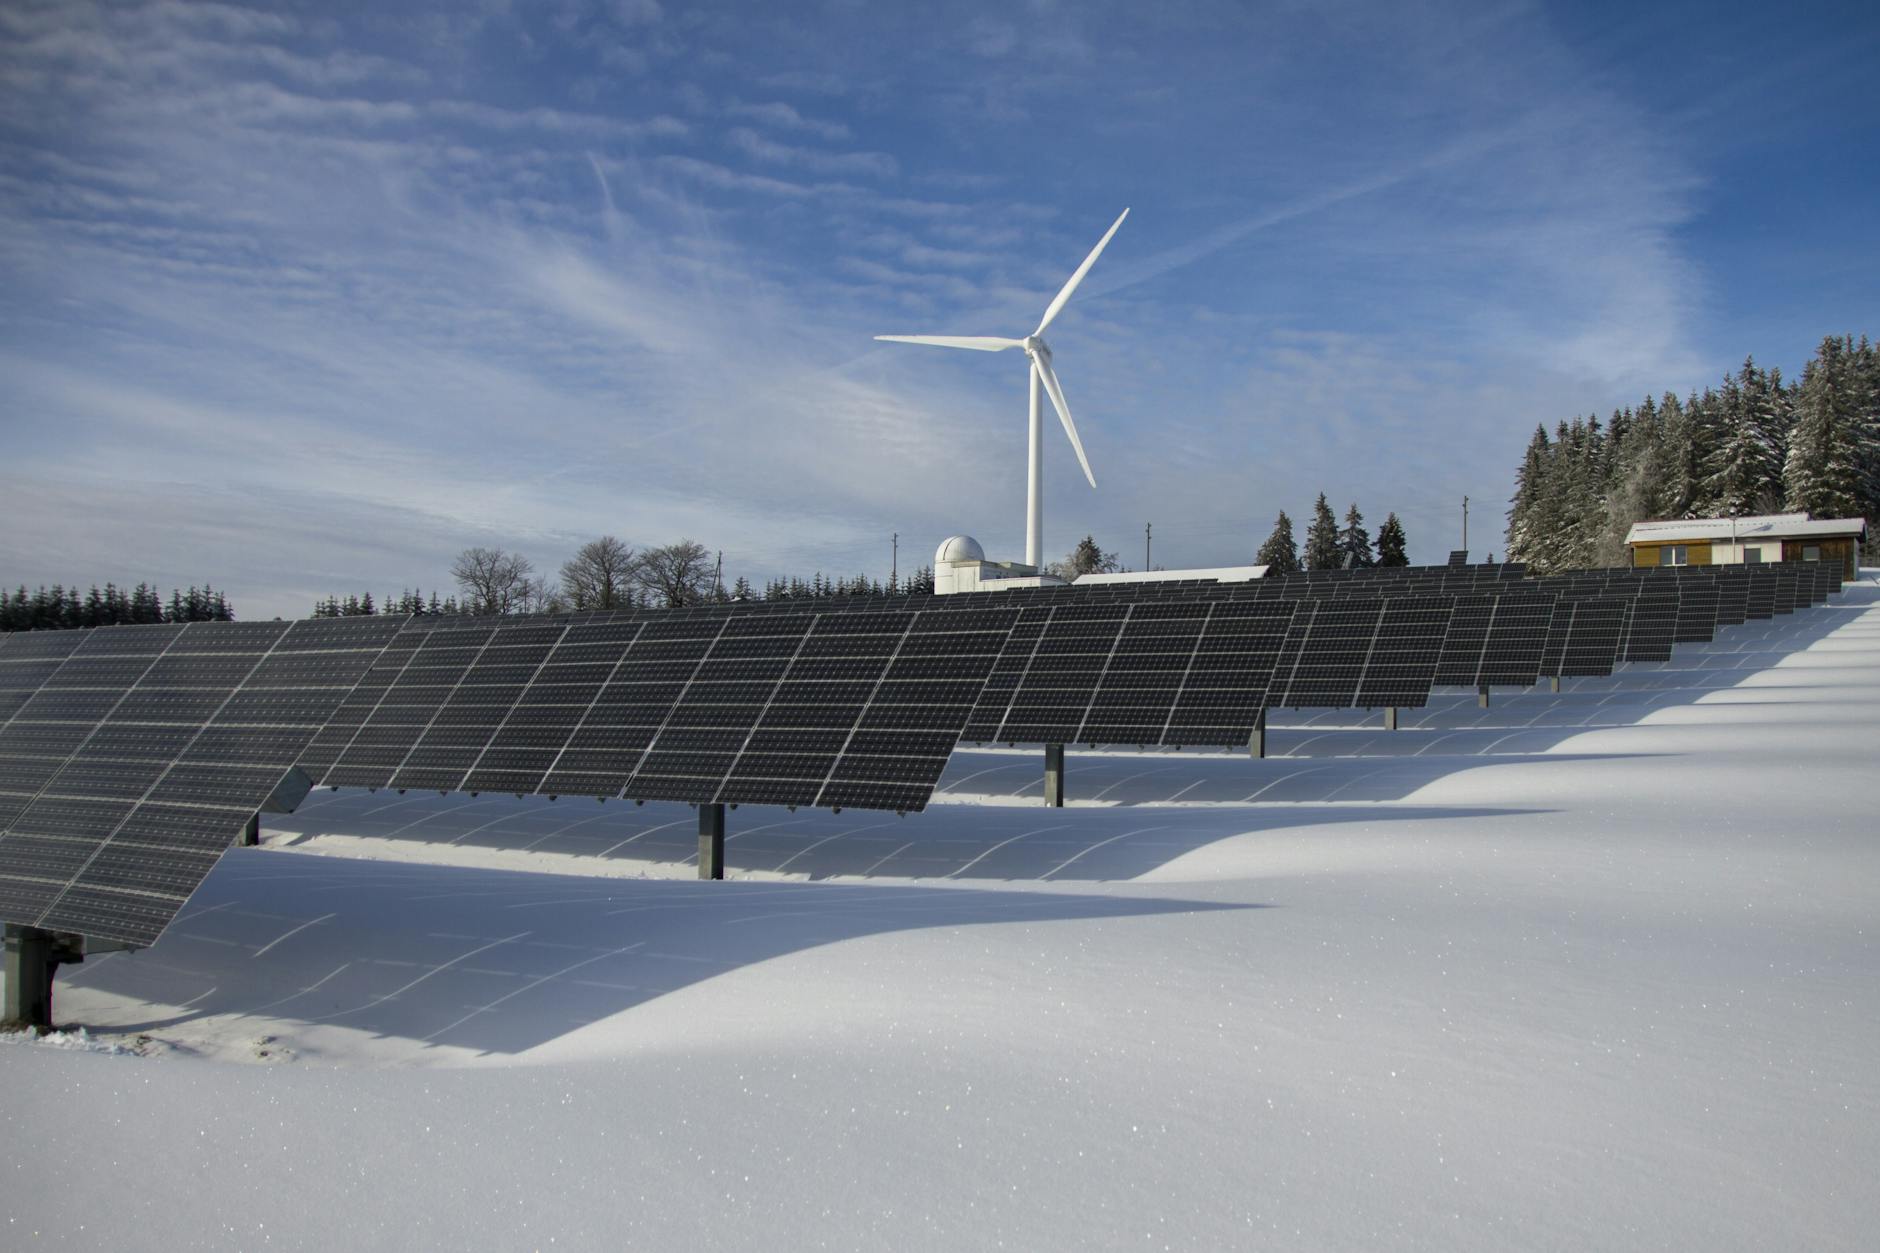
A typical 10 kW residential rooftop system. In 2026, this configuration costs $22–$35k gross, $15.4–$24.5k after the 30% federal tax credit, and pays back in 7–11 years for most U.S. homeowners.
Where solar doesn't pencil in 2026
- States with cheap electricity AND poor net-metering. Louisiana, Mississippi, Kentucky, and parts of Washington/Oregon have $0.11–$0.13/kWh power plus weak buyback programs. Payback can stretch to 15+ years — close to the panel's degradation curve.
- Heavily shaded roofs. Even 30% shade cuts production by 40–50% with string inverters (microinverters help but don't eliminate the loss). If your roof has full sun less than 5 hours/day, the math falls apart fast.
- Roofs needing replacement in 5–10 years. Removing and reinstalling solar to replace a roof costs $2,500–$6,000 in labor. Replace the roof first, or replace it bundled with the install.
- 9%+ solar loans. Lots of solar finance companies pitch "$0 down" loans at 9–11%. At those rates, your monthly loan payment often exceeds your old electric bill — defeating the entire point.
- Owners selling in < 3 years. Solar adds value to homes (typically $15–$25k per appraisal data), but you won't recoup the install premium in under 3 years. Stay or skip.
The 5 questions to answer before signing
- What's my actual electric rate, including delivery and demand charges? Look at the full $/kWh on your last 12 months of bills, not just the "supply" line. Most homeowners underestimate by 20–30%.
- What's my roof's annual sun-hours (kWh/m²/day)? Use NREL's PVWatts calculator — free, government-run. Tucson is 6.5; Boston is 4.2; Seattle is 3.4. This is the single biggest production driver.
- Is my utility on a healthy net-metering program? Full retail-rate NEM is the gold standard. Any non-1:1 buyback (CA NEM 3.0, AZ, HI, IN) materially worsens the math — often by 25–40%.
- How am I paying — cash, HELOC, or solar loan? Cash > HELOC at 7% > solar loan at 9%. The financing path is often the difference between "great investment" and "wash."
- How long am I staying? 7+ years for payback. 3 years or less and the math rarely works even with the new home value premium.
Solar + battery: when does the battery make sense?
A typical residential battery (Tesla Powerwall 3, Enphase IQ Battery 10, FranklinWH) adds $10,000–$18,000 to the install — bringing total cost to $32,000–$50,000 for panels + storage. The battery alonedoes not produce energy, so it doesn't lower your bill the way panels do. It earns its keep in three specific scenarios:
- Frequent outages. If you've lost power 3+ times in the last 12 months, a battery is worth it on resilience alone — backed up by 30% federal credit.
- Time-of-use utility rates with bad export credit. CA NEM 3.0, HI Smart Export, AZ Buy-All/Sell-All. The battery lets you self-consume your daytime production rather than exporting at $0.05–$0.08/kWh and buying back at $0.30–$0.45/kWh.
- State battery incentives. CT, MA, NY, MD, and CA have material battery-specific rebates that can cut the net battery cost in half.
The honest bottom line
For roughly 60% of U.S. homeowners with $150+ monthly bills, owner-occupied homes, decent sun, and a 7+ year stay horizon, solar still makes sense in 2026 — particularly if paid in cash or with a HELOC.
For the other 40%, it's marginal at best. The biggest mistake homeowners make in 2026 is signing a 9–11% APR solar loan that quietly turns a "good investment" into a "neutral monthly swap." If the only way you can afford solar is a high-rate loan, the answer for most people is to wait, save, or pay cash later.
Run the numbers on your specific scope first:
- Solar panel cost calculator — state-adjusted estimate by system size and quality
- Why renovation costs differ by state — context for the regional multipliers
- How to finance a home renovation in 2026 — HELOC vs cash-out refi vs solar loan trade-offs
Sources: NREL PVWatts (2026 baseline), Energy Information Administration state retail rates (Q1 2026), Wood Mackenzie U.S. Solar Market Insight Report (2025–26), and contractor pricing data from a 2025 sample of U.S. residential solar installers. The federal Residential Clean Energy Credit is set at 30% through 2032 under current law; future changes are outside the scope of this analysis.
For state-by-state payback numbers — all 50 US states ranked from fastest (Hawaii 3.1 yr, Massachusetts 3.7 yr, Connecticut 4.1 yr) to slowest (North Dakota 11.5 yr, Washington 11.4 yr) — see our companion pillar: Solar Panel ROI by State 2026 — All 50 States Ranked. Built on the same EIA × NREL × state net-metering data the calculator uses.