Atlas variant · Quick-resale edition
Quick-resale kitchen picks by state — 2026.
For flip-house investors and time-sensitive sellers. Each state's quick-resale score combines projected kitchen ROI with 2026 median days-on-market — a 30-day market doubles the effective payback velocity of a 60-day market. National average DOM: 45 days.
50 states · DOM data sourced from Realtor.com 2025-Q4 / 2026-Q1 medians
| State | Median DOM | ROI | Install cost | Quick-resale score | |
|---|---|---|---|---|---|
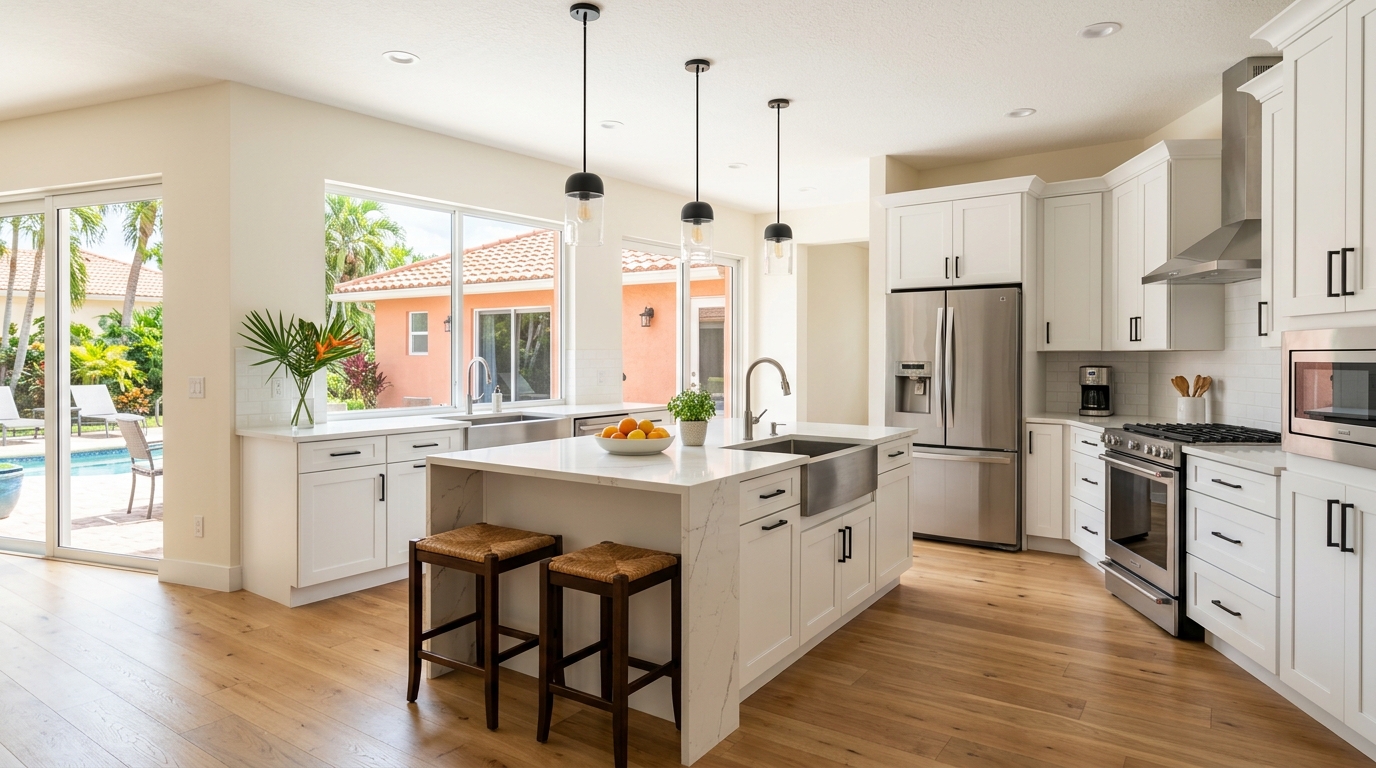 FLFlorida FLFlorida | 30d | 82% | $44,000 | 164 | Read guide |
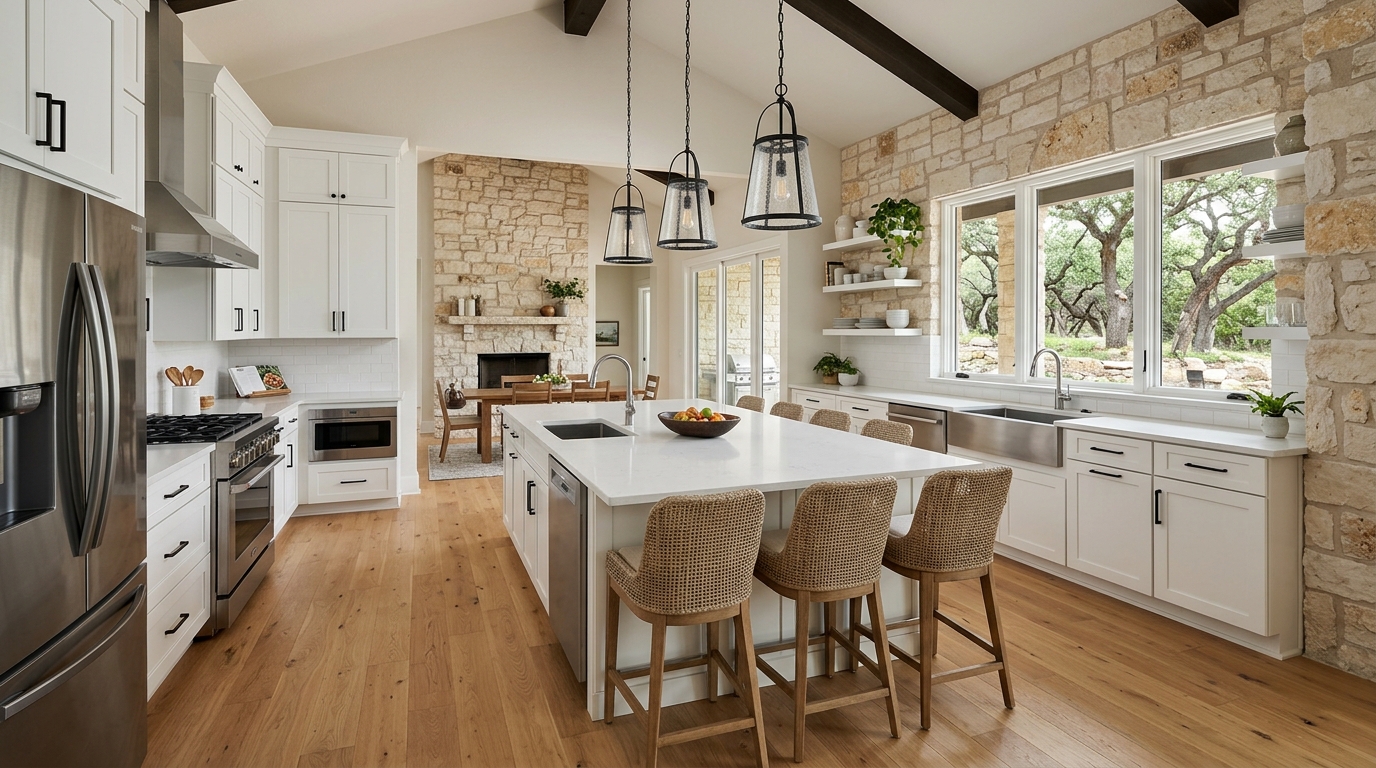 TXTexas TXTexas | 30d | 82% | $44,000 | 164 | Read guide |
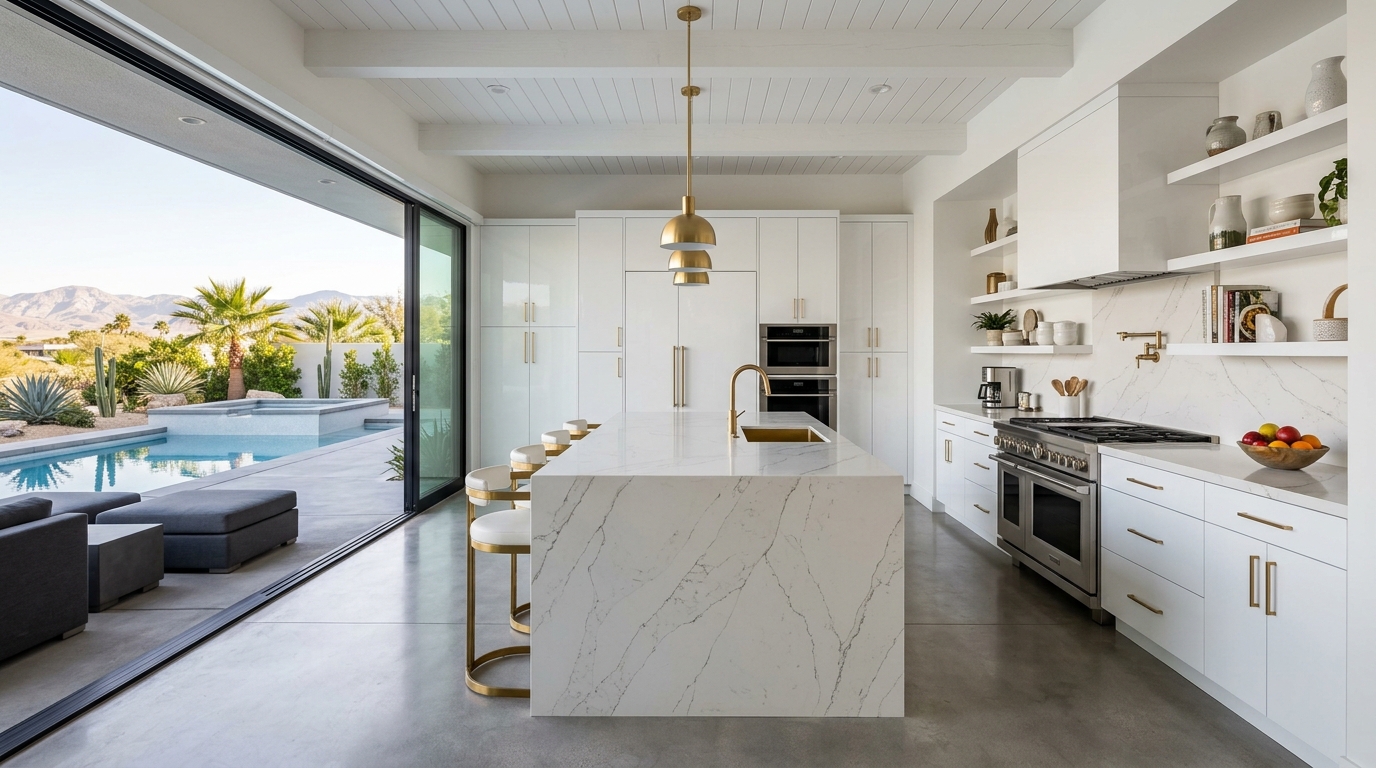 NVNevada NVNevada | 30d | 81% | $46,300 | 162 | Read guide |
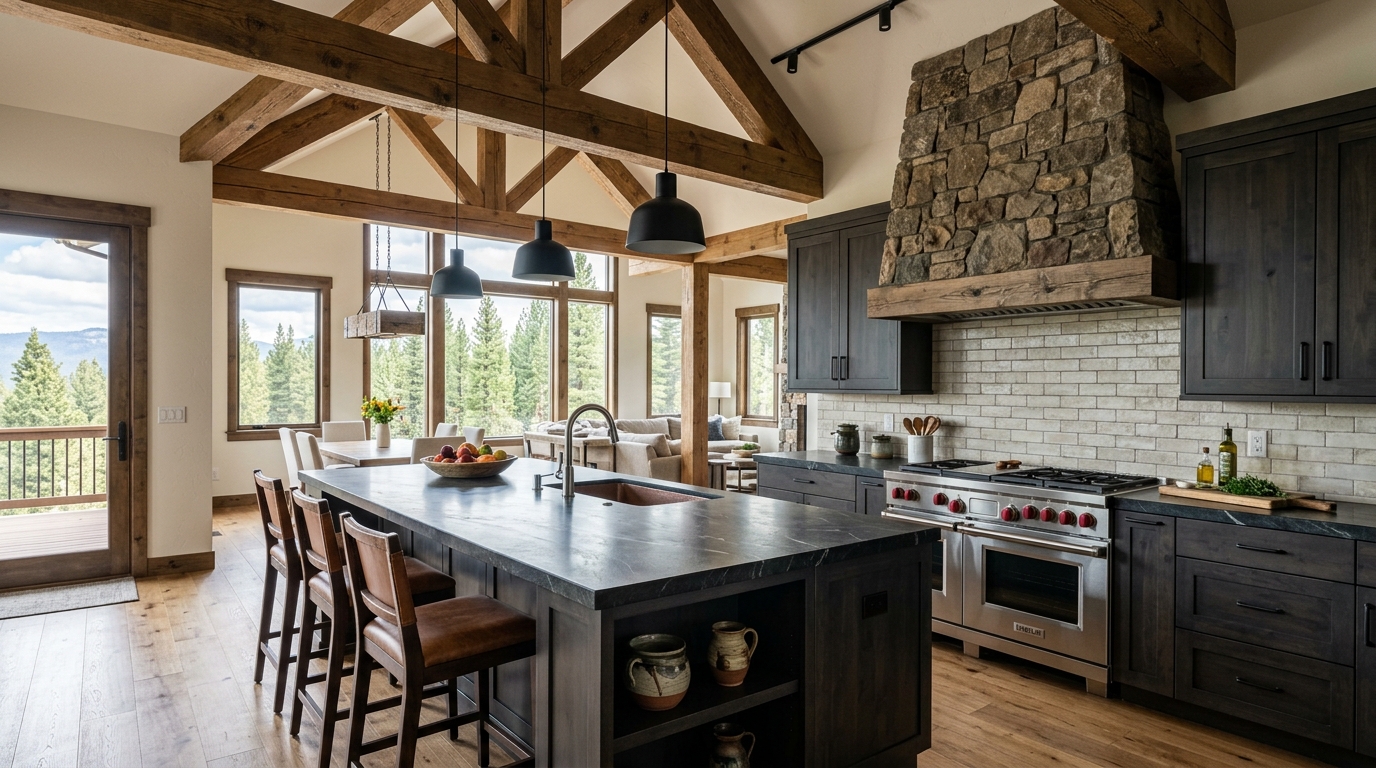 IDIdaho IDIdaho | 30d | 79% | $40,500 | 158 | Read guide |
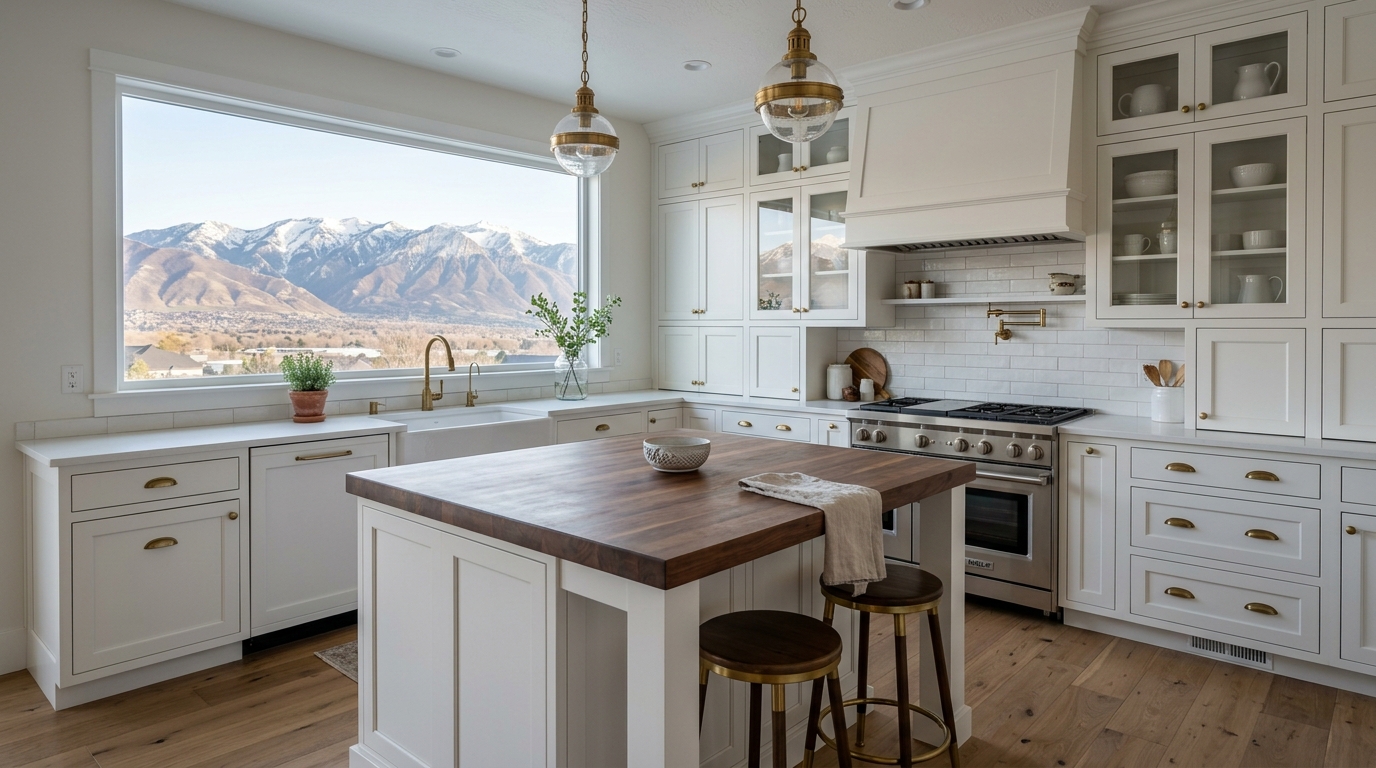 UTUtah UTUtah | 30d | 79% | $44,900 | 158 | Read guide |
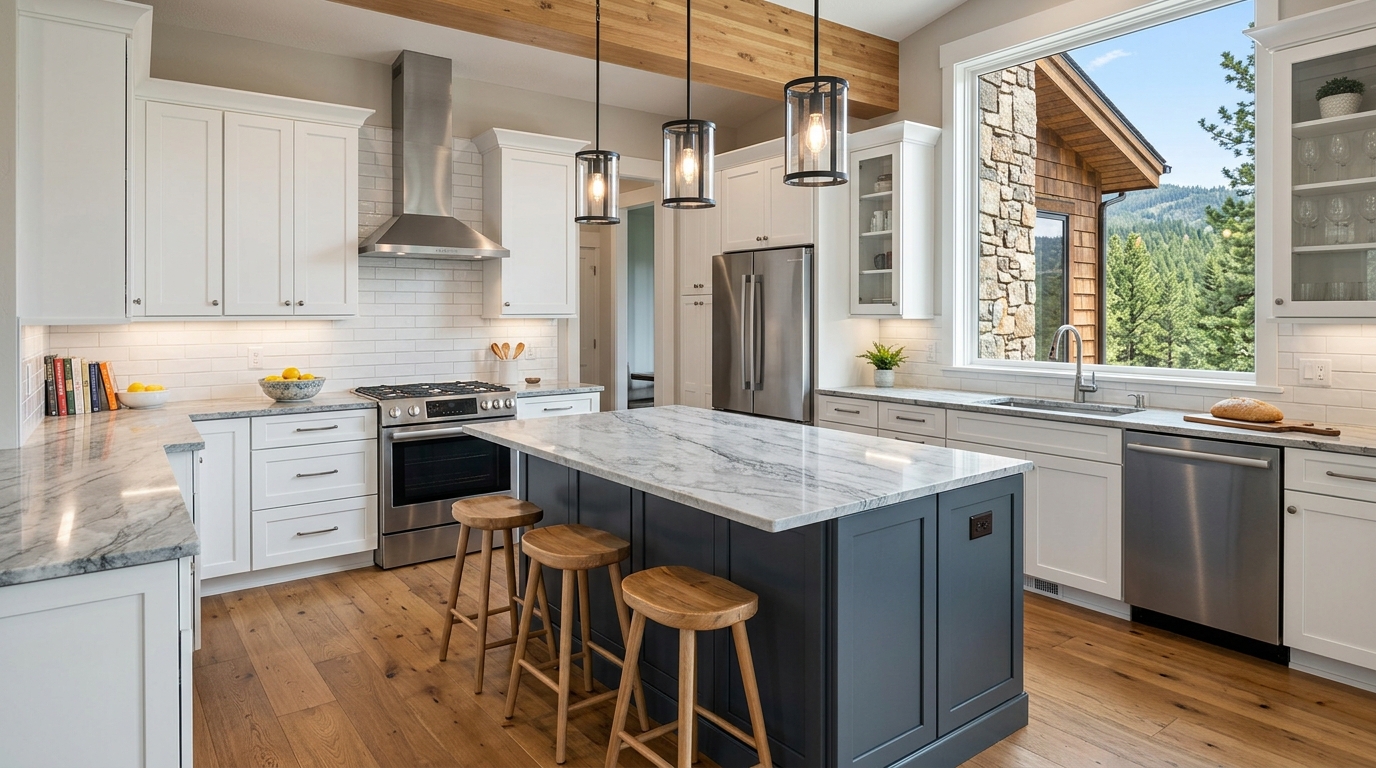 COColorado COColorado | 30d | 78% | $50,600 | 156 | Read guide |
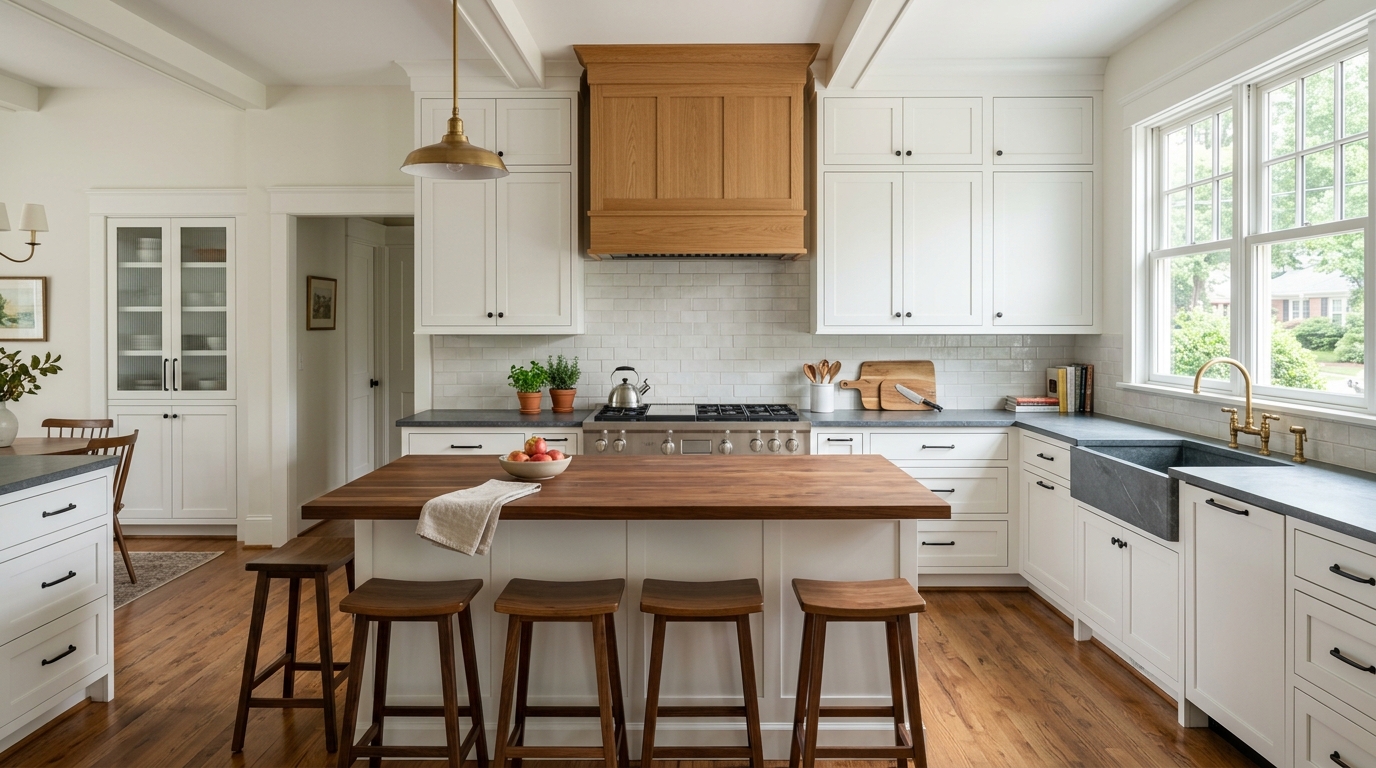 NCNorth Carolina NCNorth Carolina | 35d | 85% | $43,100 | 146 | Read guide |
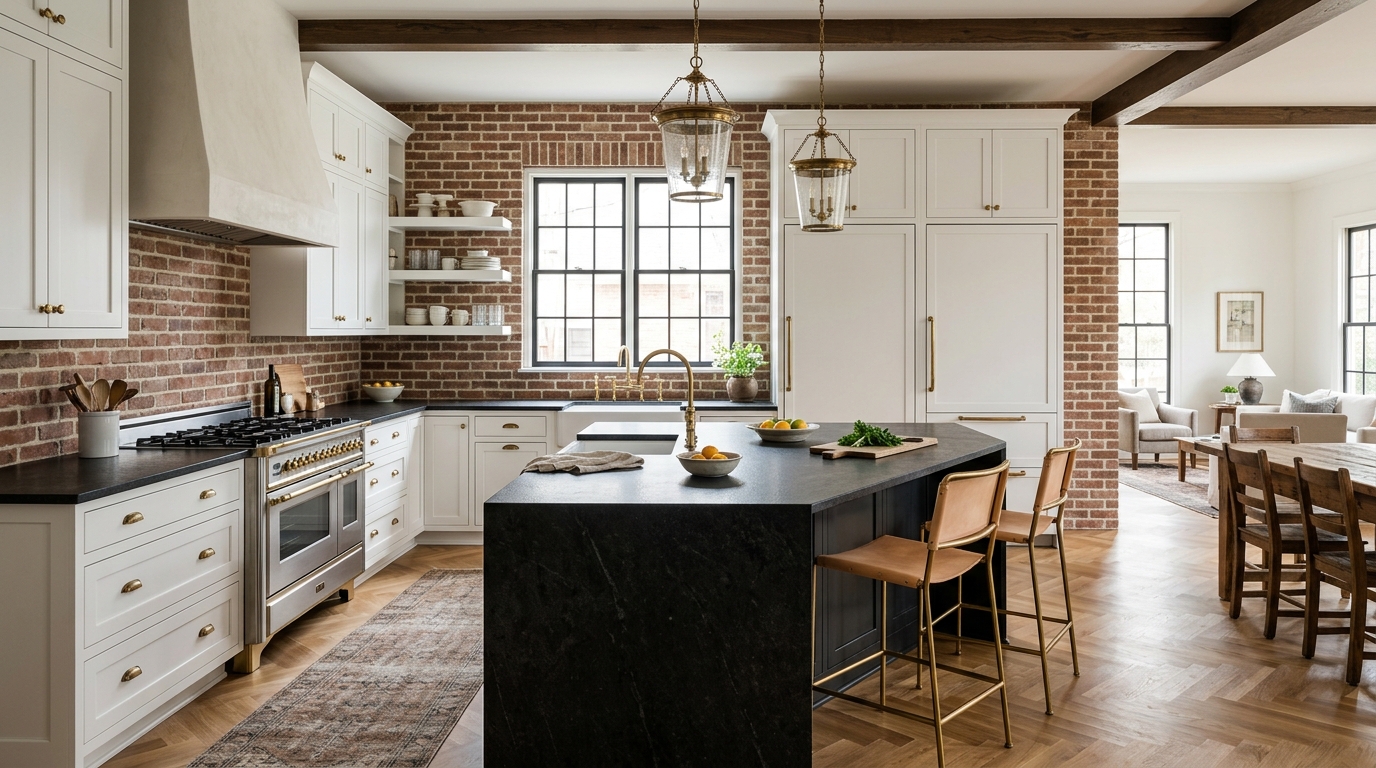 GAGeorgia GAGeorgia | 35d | 84% | $42,300 | 144 | Read guide |
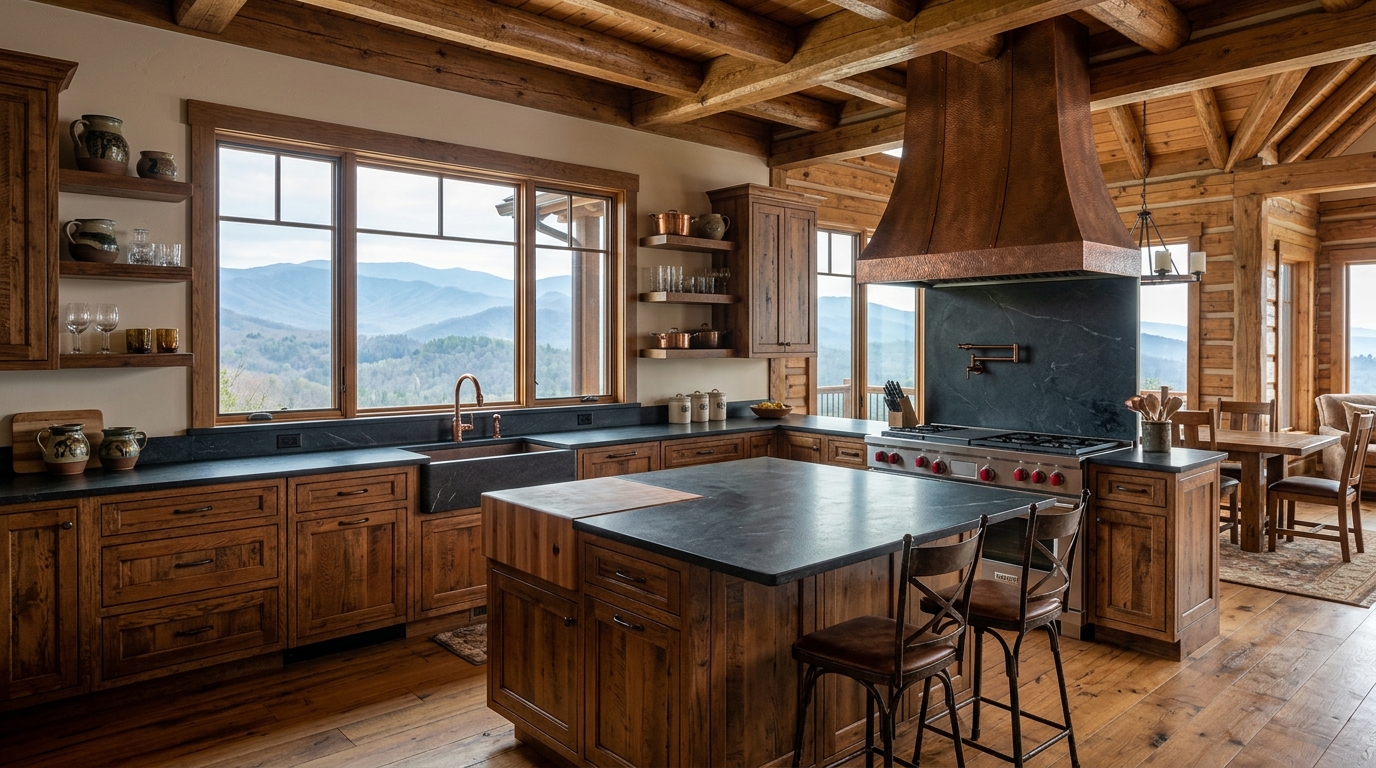 TNTennessee TNTennessee | 35d | 84% | $41,000 | 144 | Read guide |
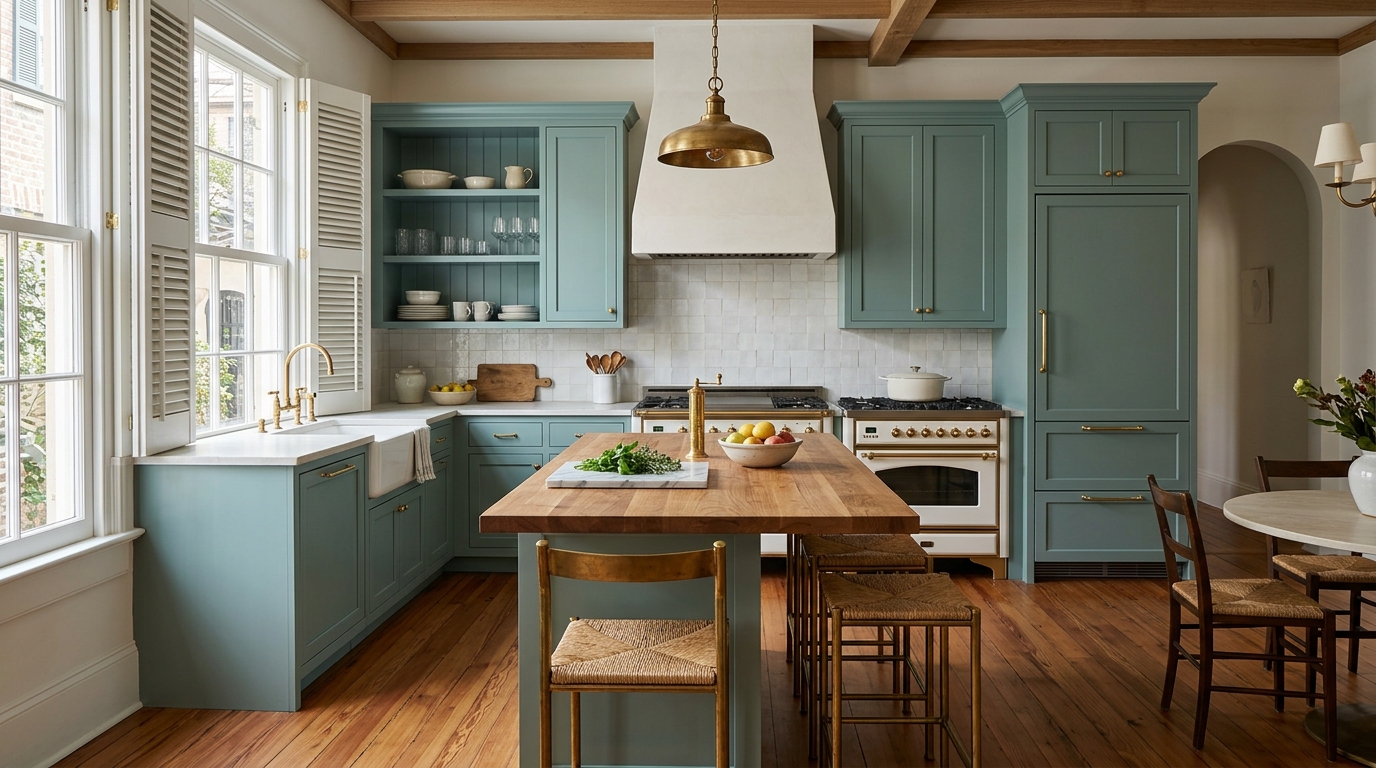 SCSouth Carolina SCSouth Carolina | 35d | 82% | $41,900 | 141 | Read guide |
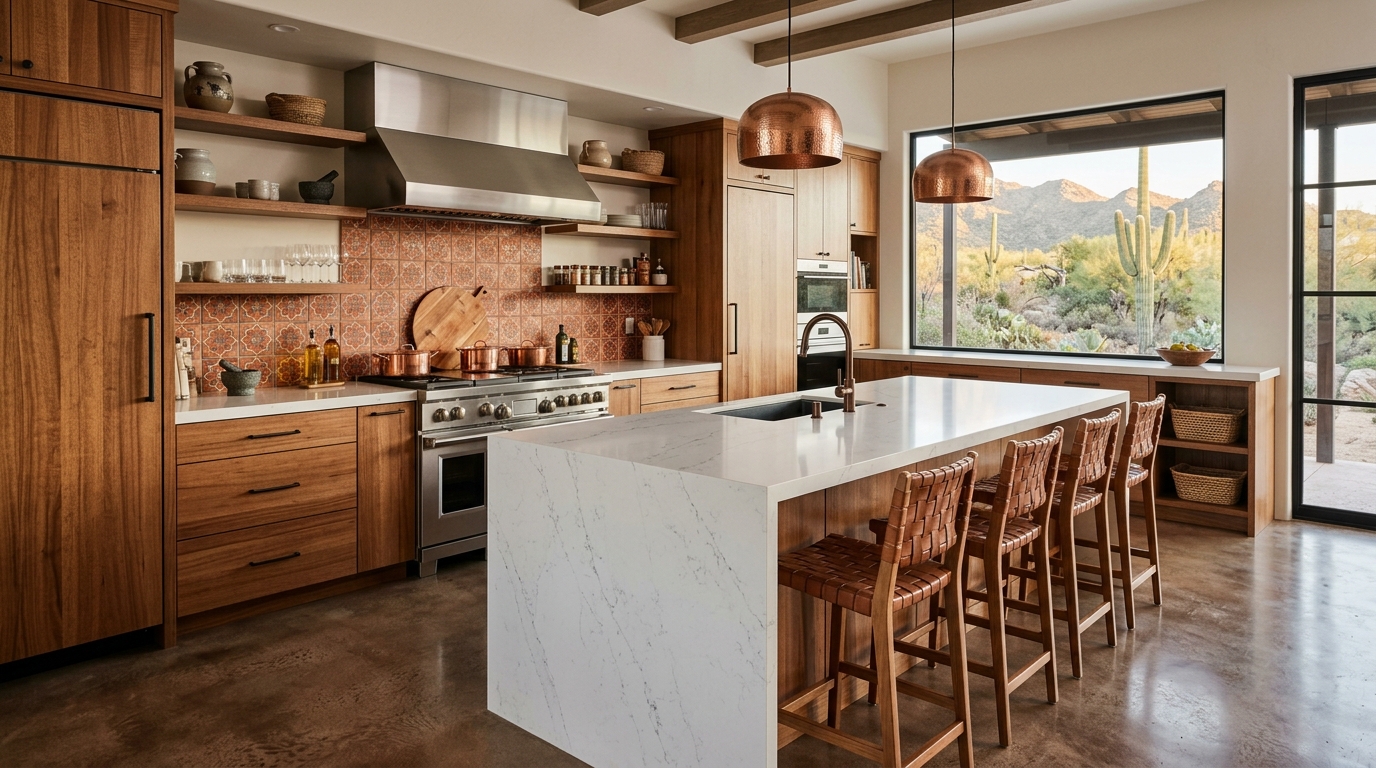 AZArizona AZArizona | 35d | 81% | $44,000 | 139 | Read guide |
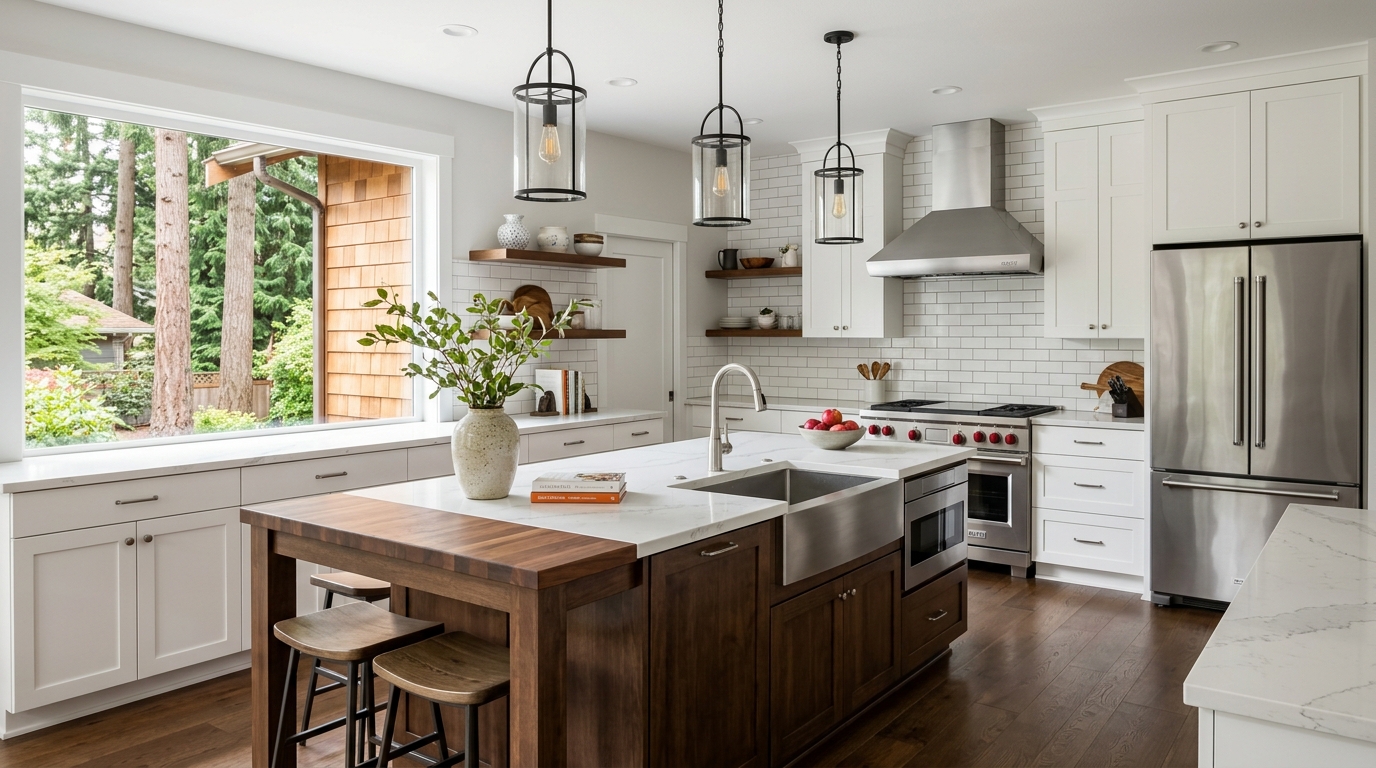 WAWashington WAWashington | 35d | 73% | $51,900 | 125 | Read guide |
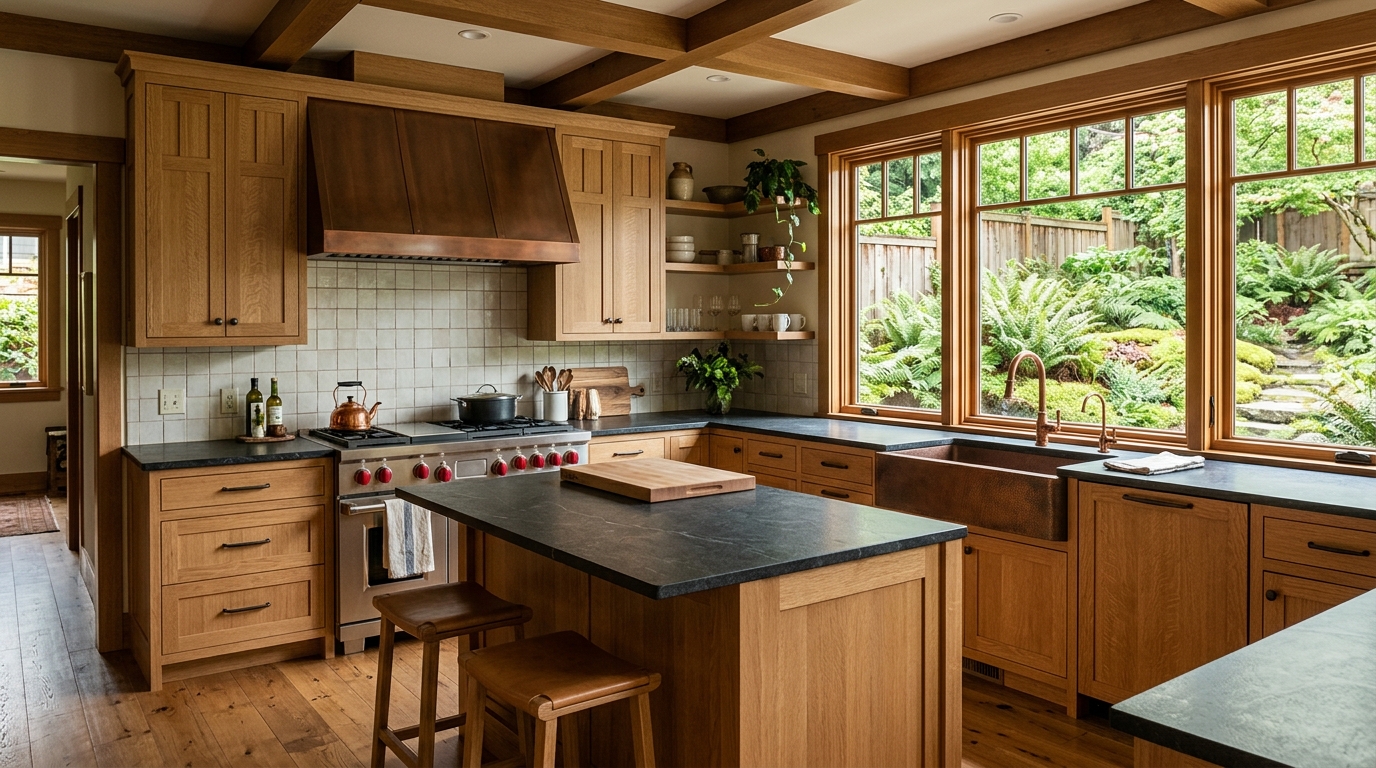 OROregon OROregon | 35d | 72% | $49,300 | 123 | Read guide |
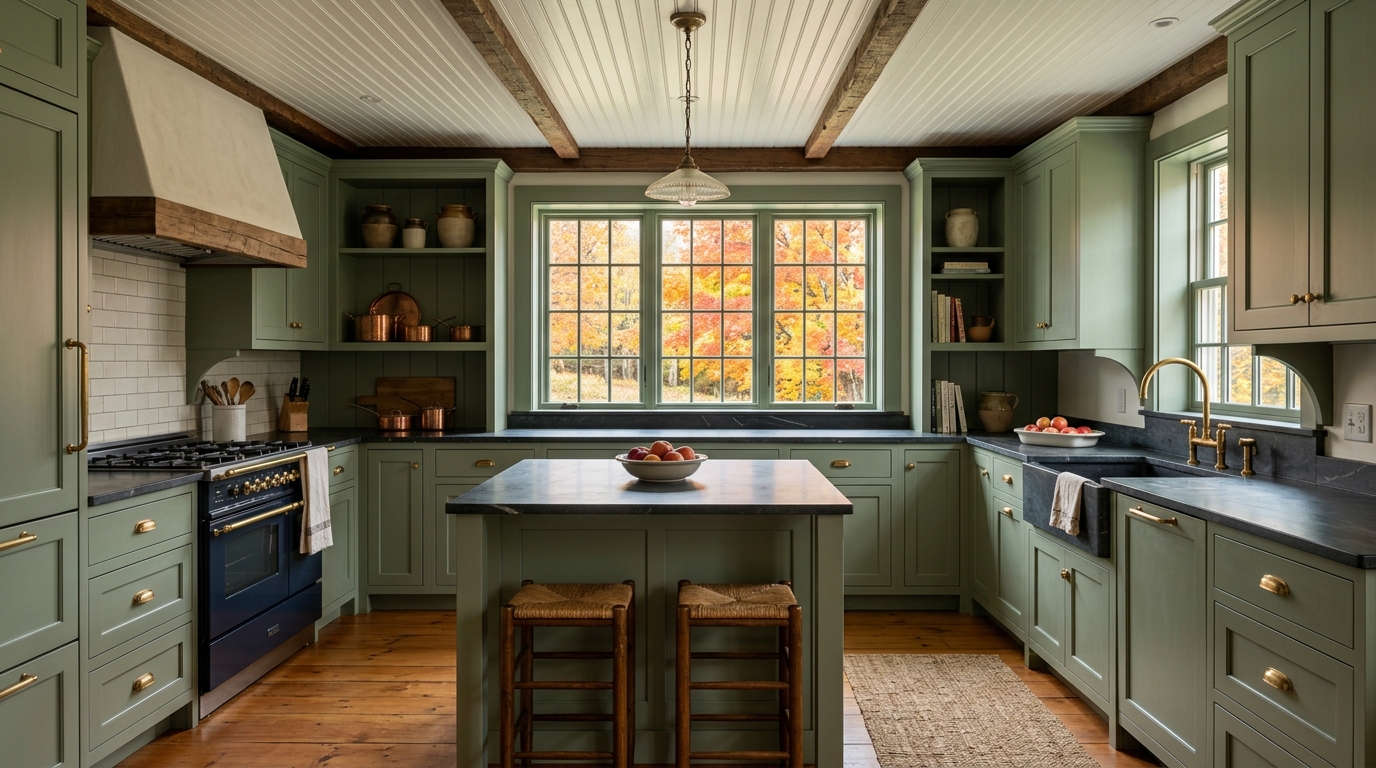 NHNew Hampshire NHNew Hampshire | 40d | 79% | $50,600 | 119 | Read guide |
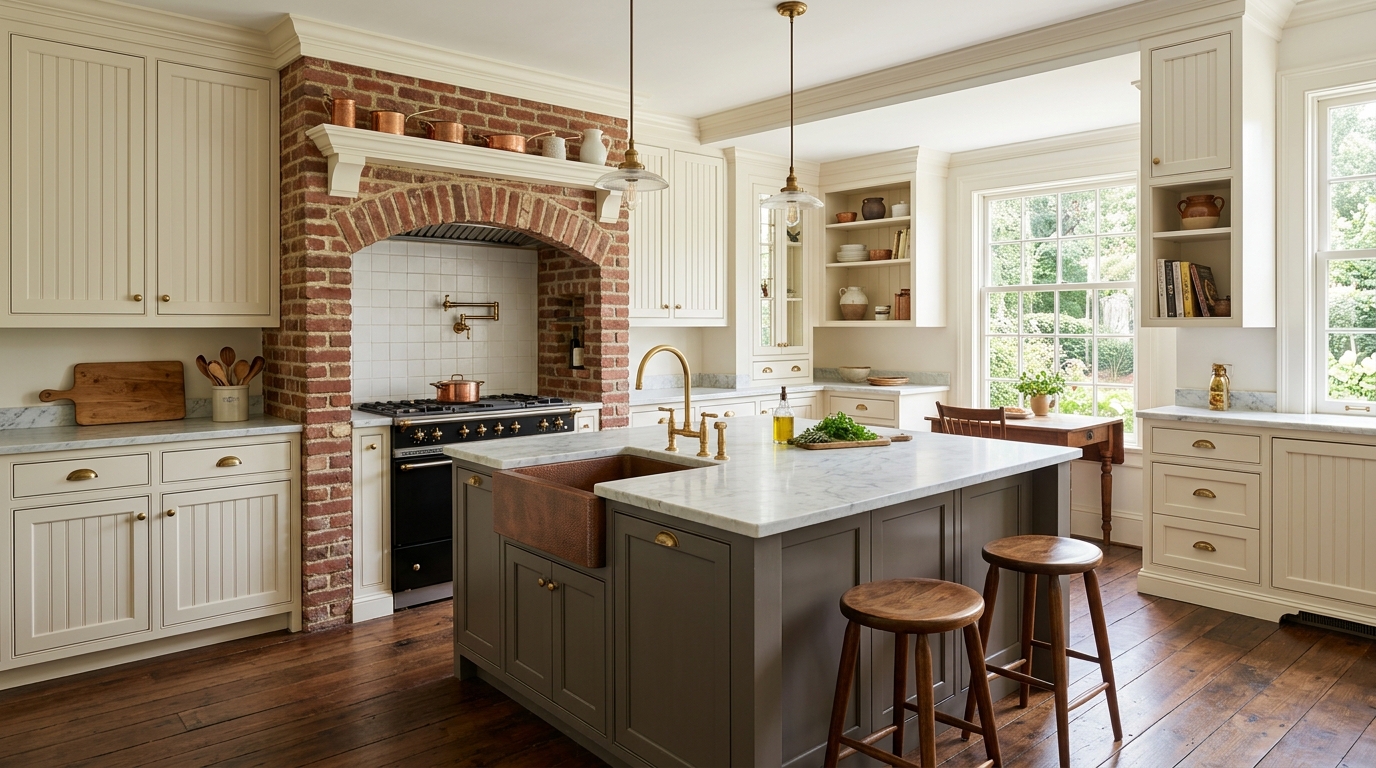 VAVirginia VAVirginia | 40d | 75% | $47,500 | 113 | Read guide |
 MDMaryland MDMaryland | 40d | 73% | $52,800 | 110 | Read guide |
 DEDelaware DEDelaware | 40d | 72% | $46,300 | 108 | Read guide |
 INIndiana INIndiana | 45d | 79% | $38,700 | 105 | Read guide |
 OHOhio OHOhio | 45d | 78% | $40,500 | 104 | Read guide |
 MNMinnesota MNMinnesota | 45d | 73% | $44,000 | 97 | Read guide |
 MOMissouri MOMissouri | 45d | 73% | $40,100 | 97 | Read guide |
 IAIowa IAIowa | 45d | 72% | $37,900 | 96 | Read guide |
 MIMichigan MIMichigan | 45d | 72% | $40,100 | 96 | Read guide |
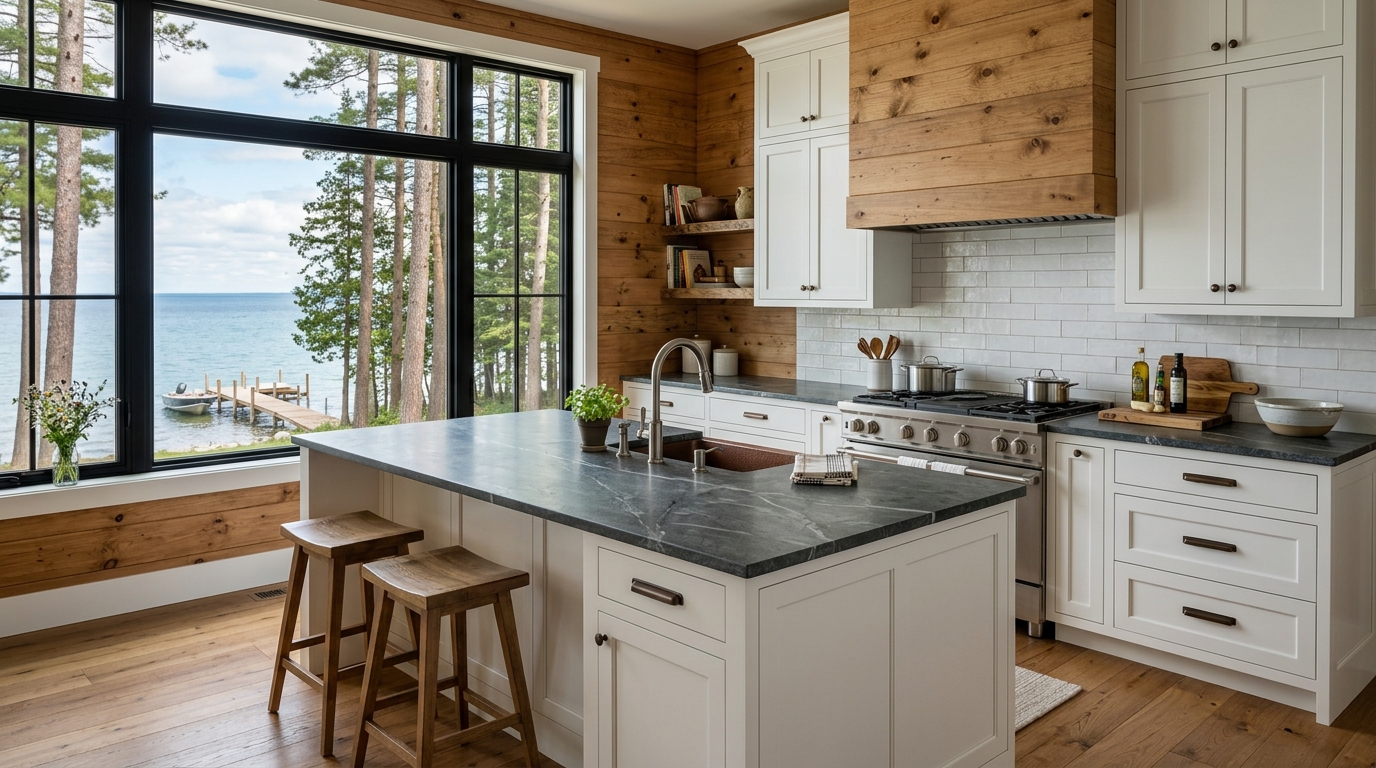 WIWisconsin WIWisconsin | 45d | 72% | $41,000 | 96 | Read guide |
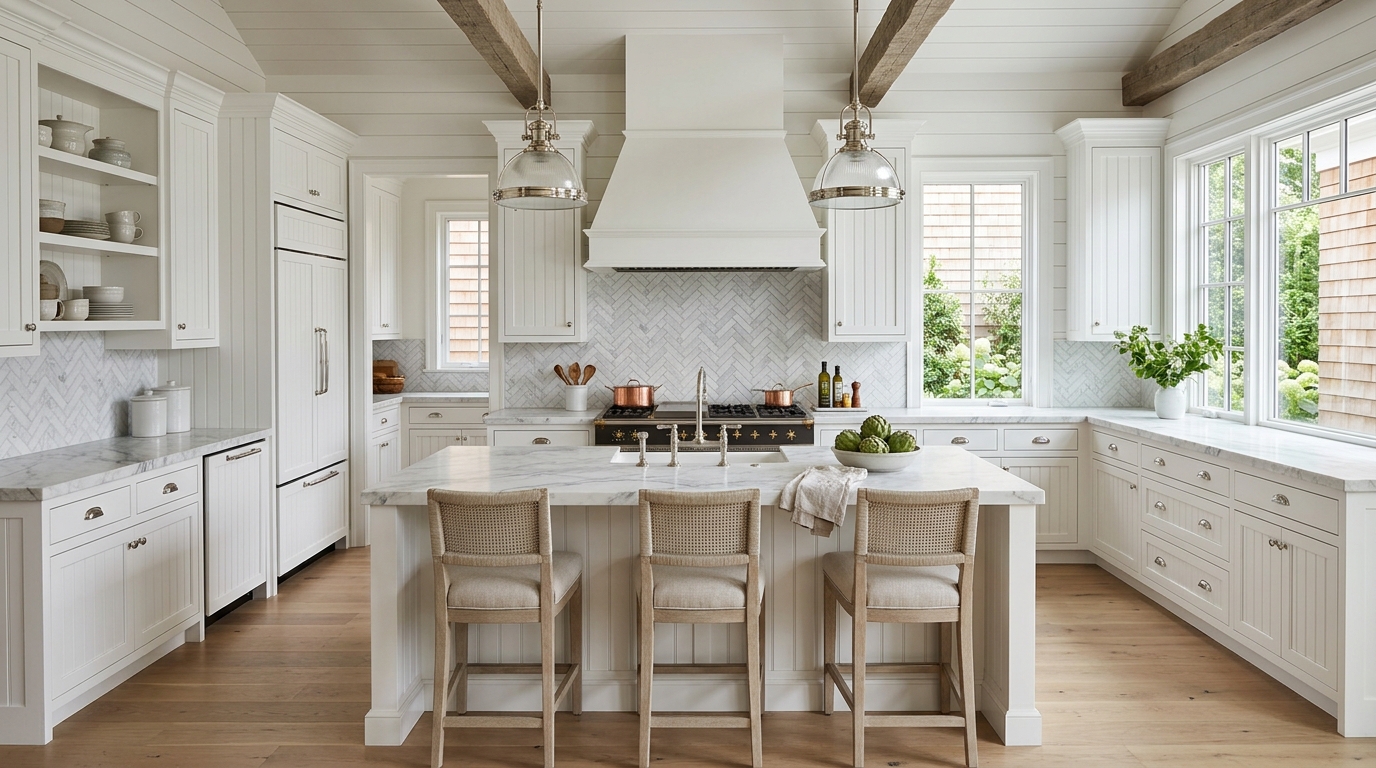 RIRhode Island RIRhode Island | 45d | 71% | $53,700 | 95 | Read guide |
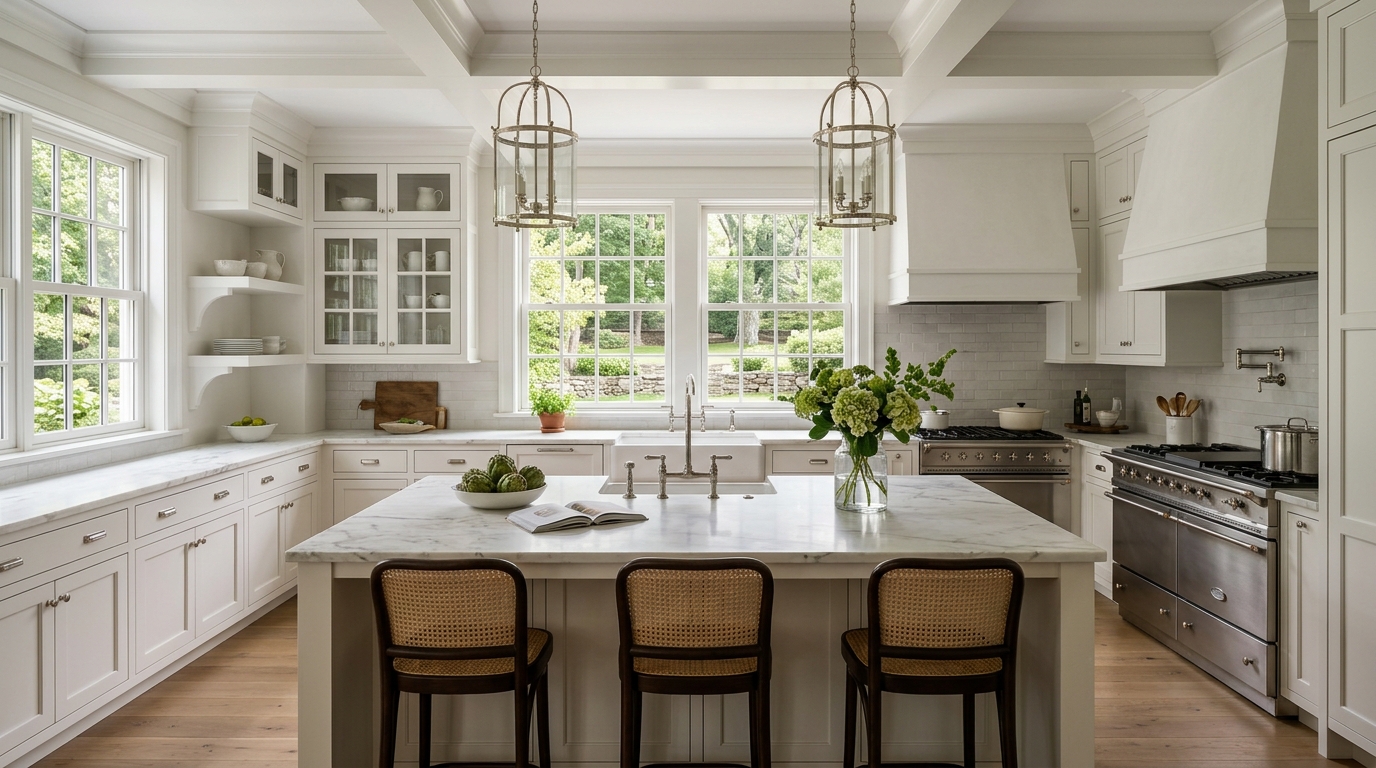 CTConnecticut CTConnecticut | 40d | 61% | $57,200 | 92 | Read guide |
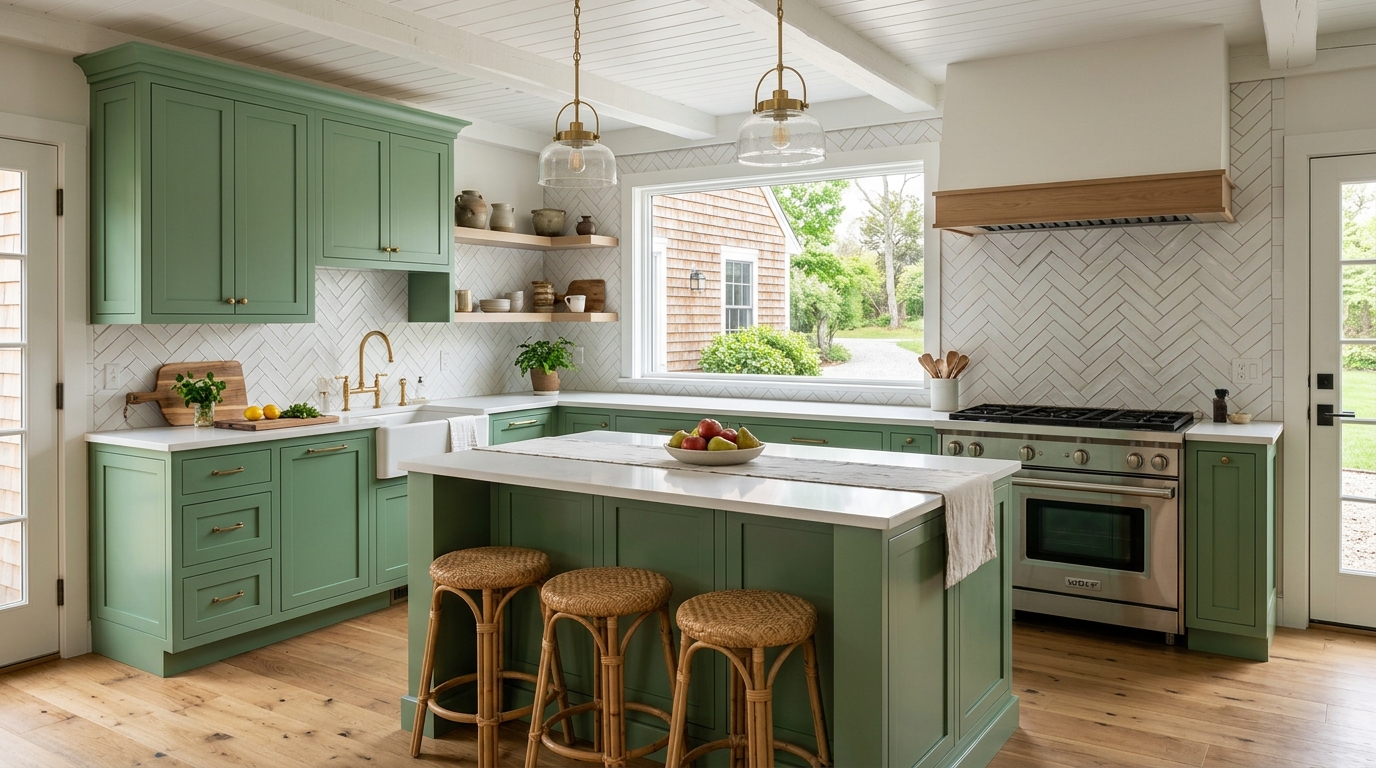 MAMassachusetts MAMassachusetts | 40d | 59% | $58,100 | 89 | Read guide |
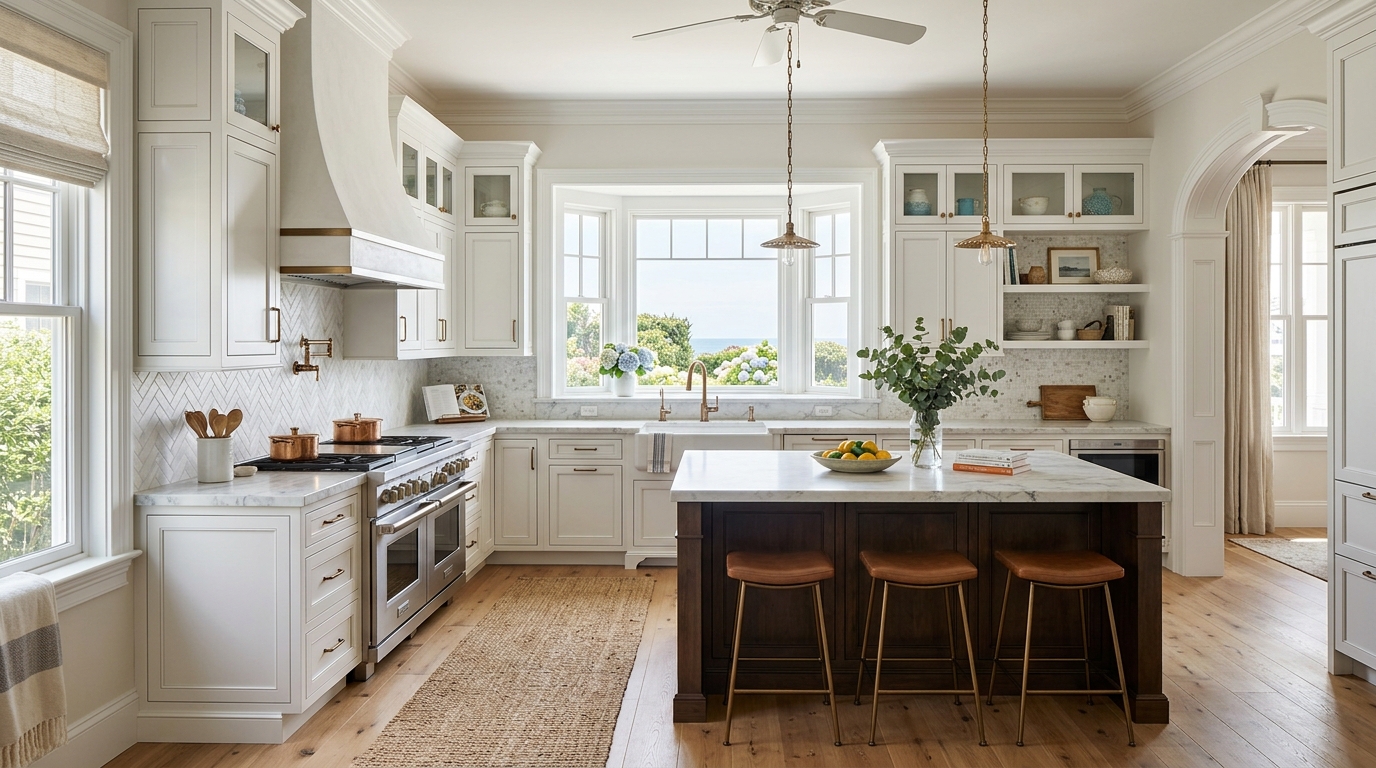 NJNew Jersey NJNew Jersey | 40d | 59% | $56,300 | 89 | Read guide |
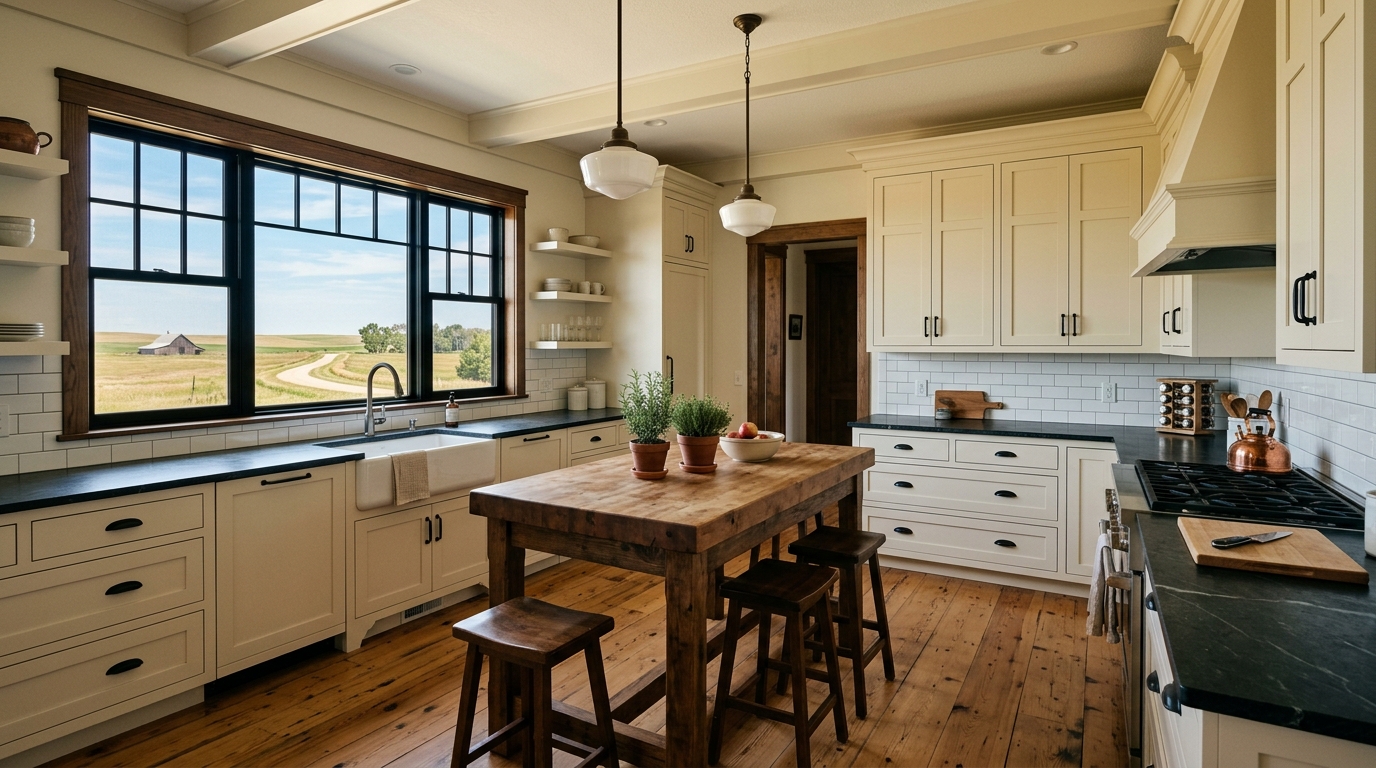 SDSouth Dakota SDSouth Dakota | 50d | 73% | $37,500 | 88 | Read guide |
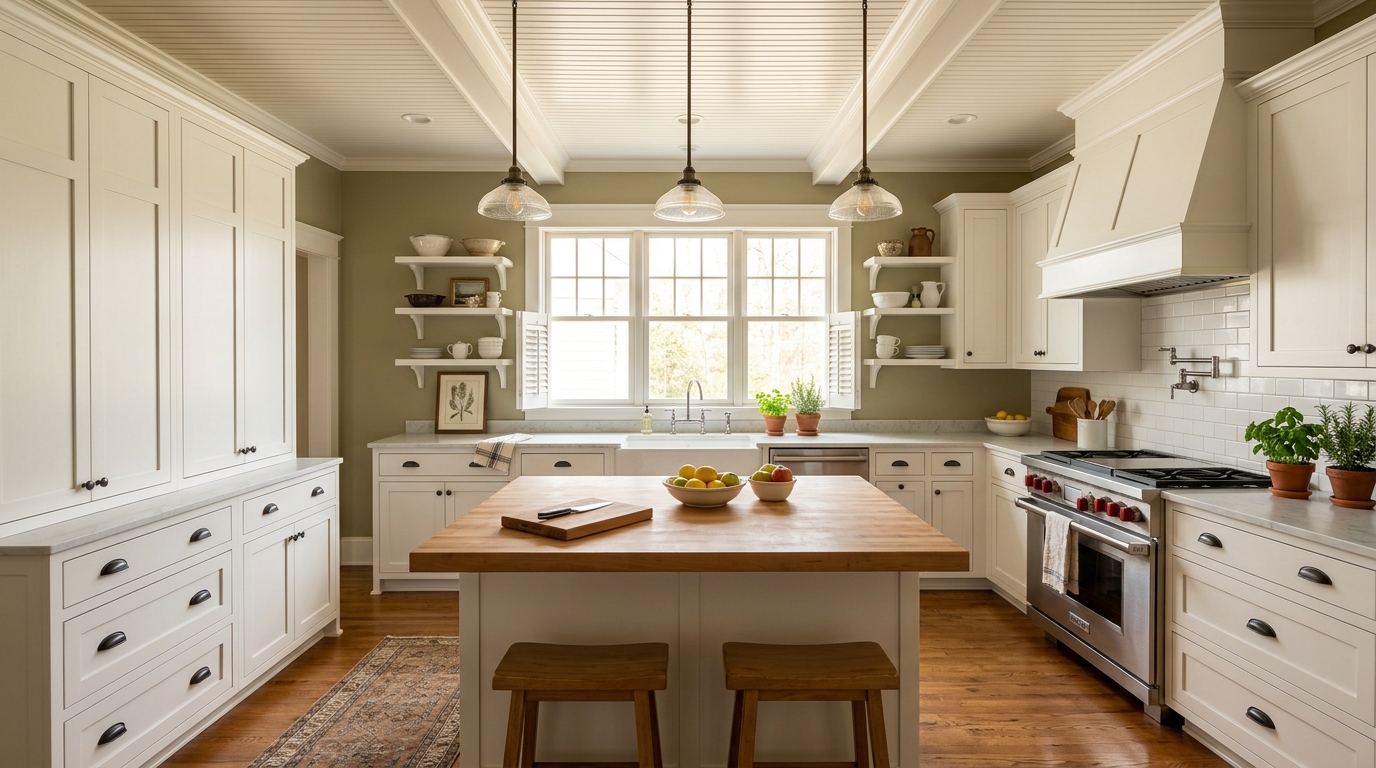 ALAlabama ALAlabama | 55d | 79% | $37,900 | 86 | Read guide |
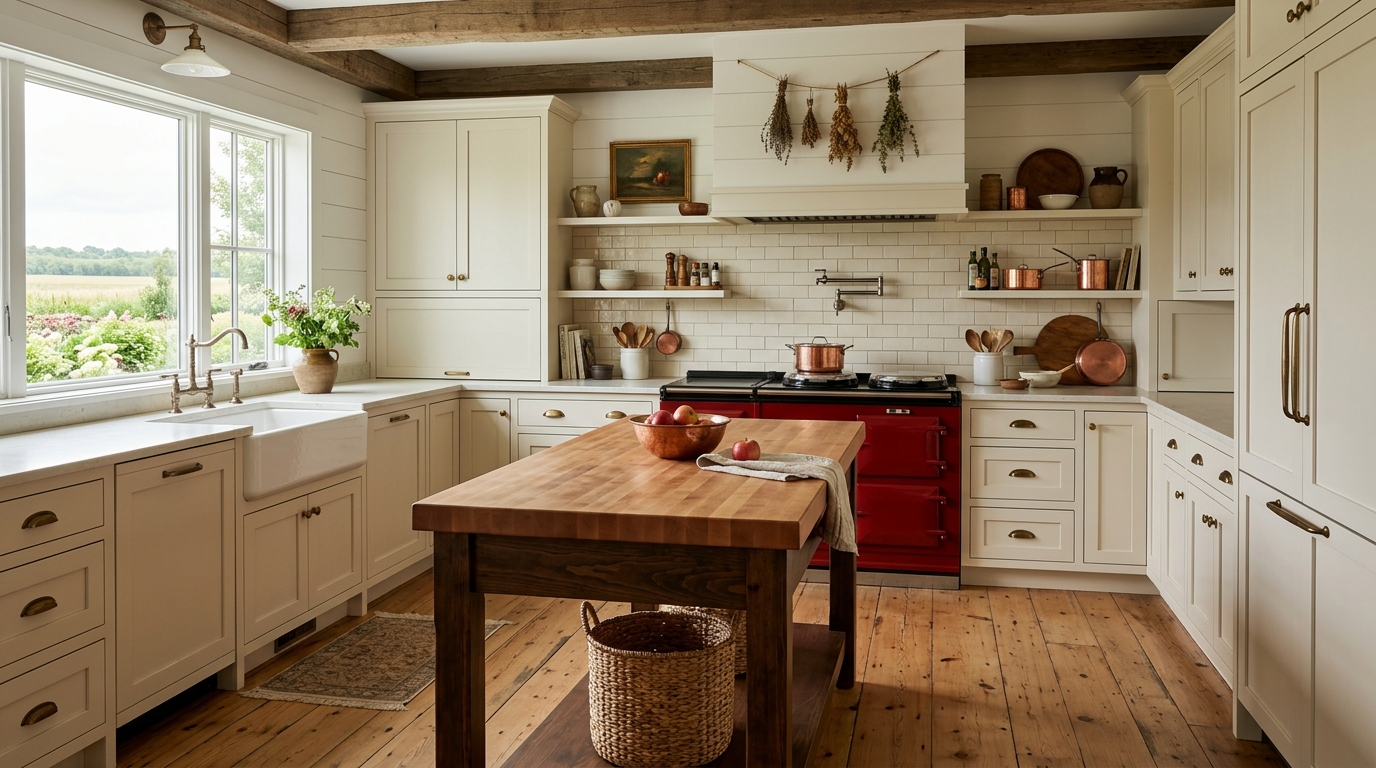 NENebraska NENebraska | 50d | 72% | $38,300 | 86 | Read guide |
 PAPennsylvania PAPennsylvania | 50d | 72% | $44,900 | 86 | Read guide |
 ILIllinois ILIllinois | 50d | 71% | $41,900 | 85 | Read guide |
 KYKentucky KYKentucky | 55d | 78% | $39,600 | 85 | Read guide |
 OKOklahoma OKOklahoma | 55d | 78% | $37,900 | 85 | Read guide |
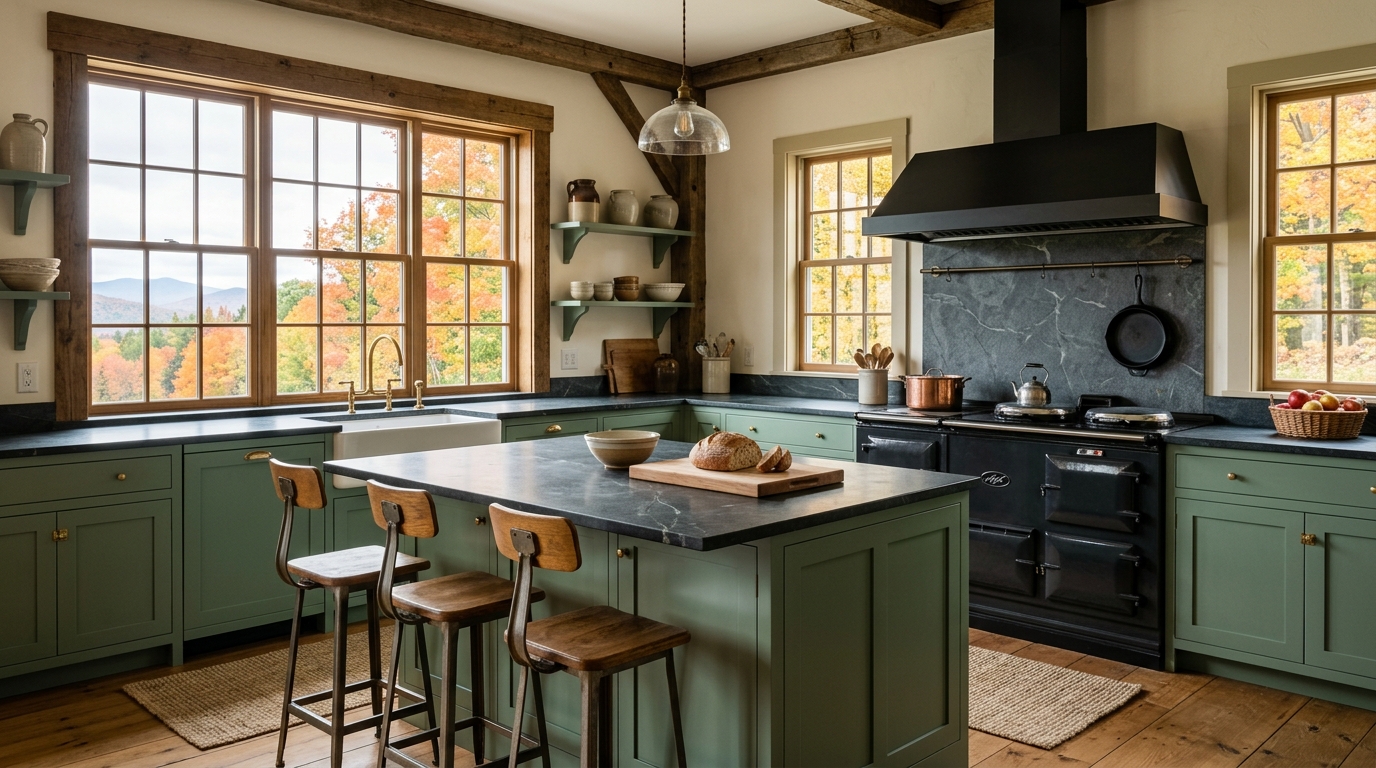 VTVermont VTVermont | 50d | 71% | $48,400 | 85 | Read guide |
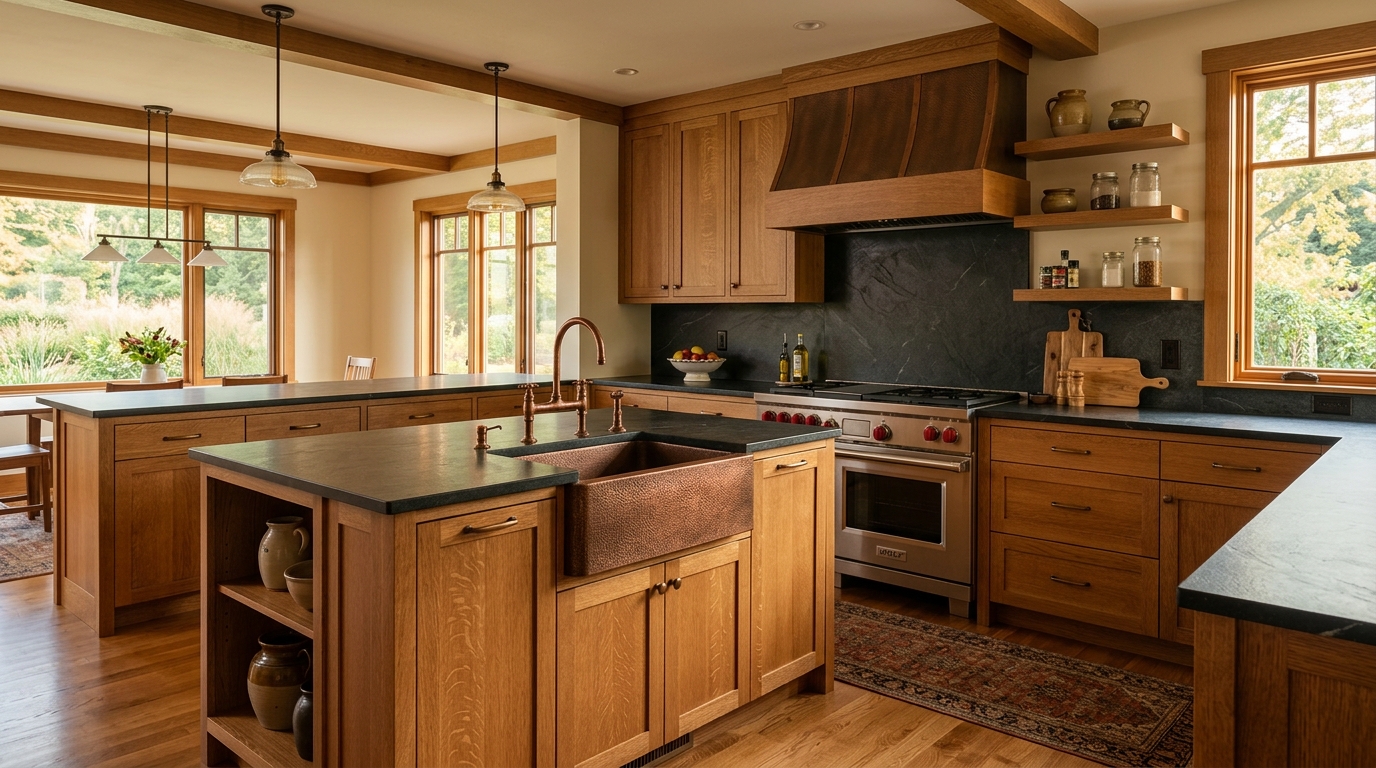 KSKansas KSKansas | 55d | 73% | $38,700 | 80 | Read guide |
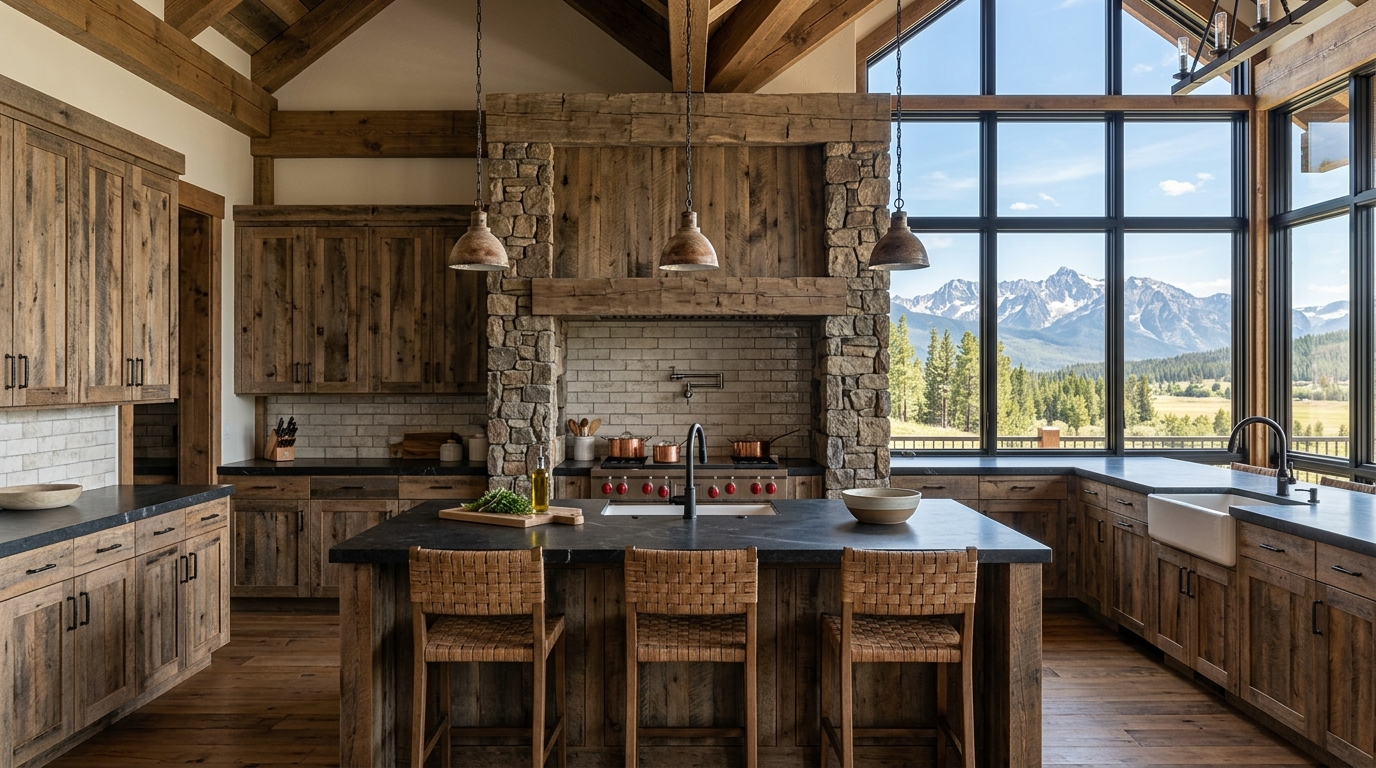 MTMontana MTMontana | 55d | 73% | $42,700 | 80 | Read guide |
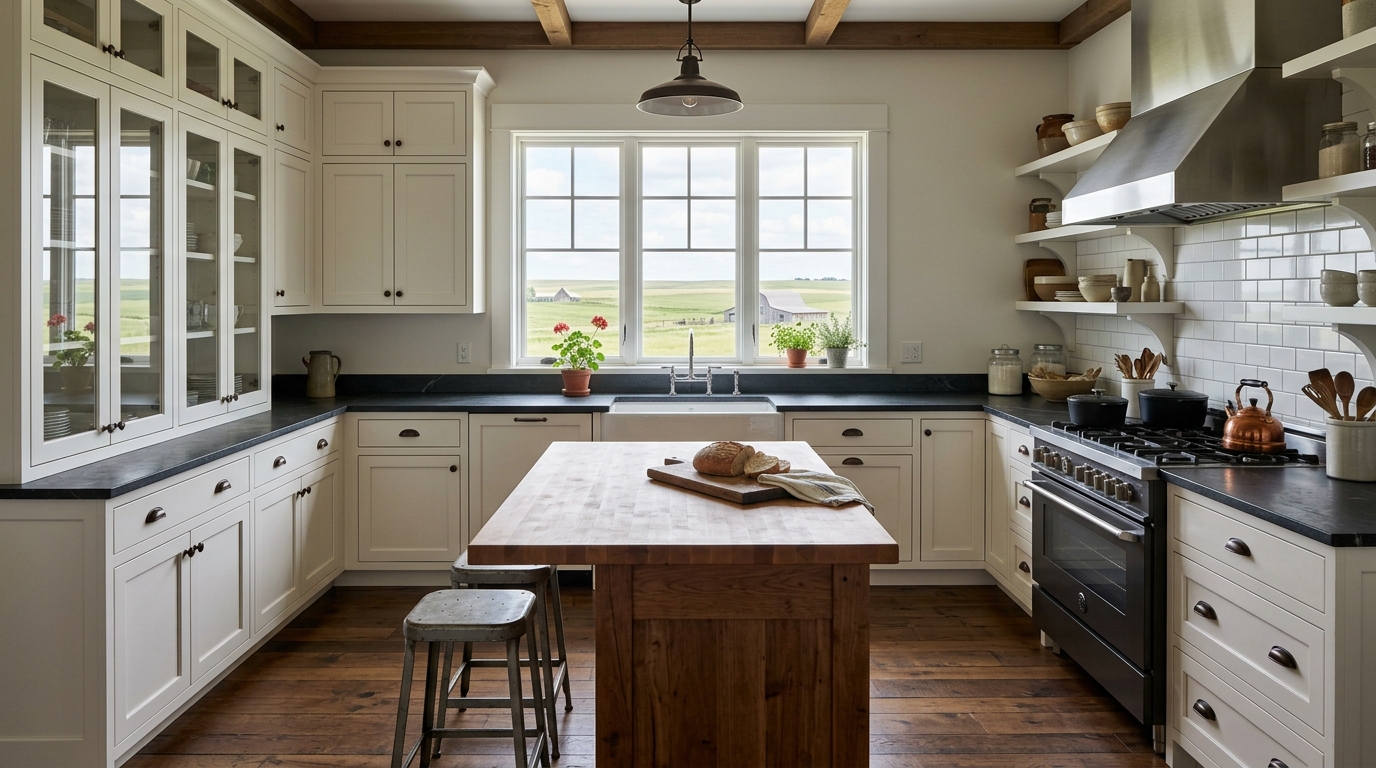 NDNorth Dakota NDNorth Dakota | 55d | 73% | $37,900 | 80 | Read guide |
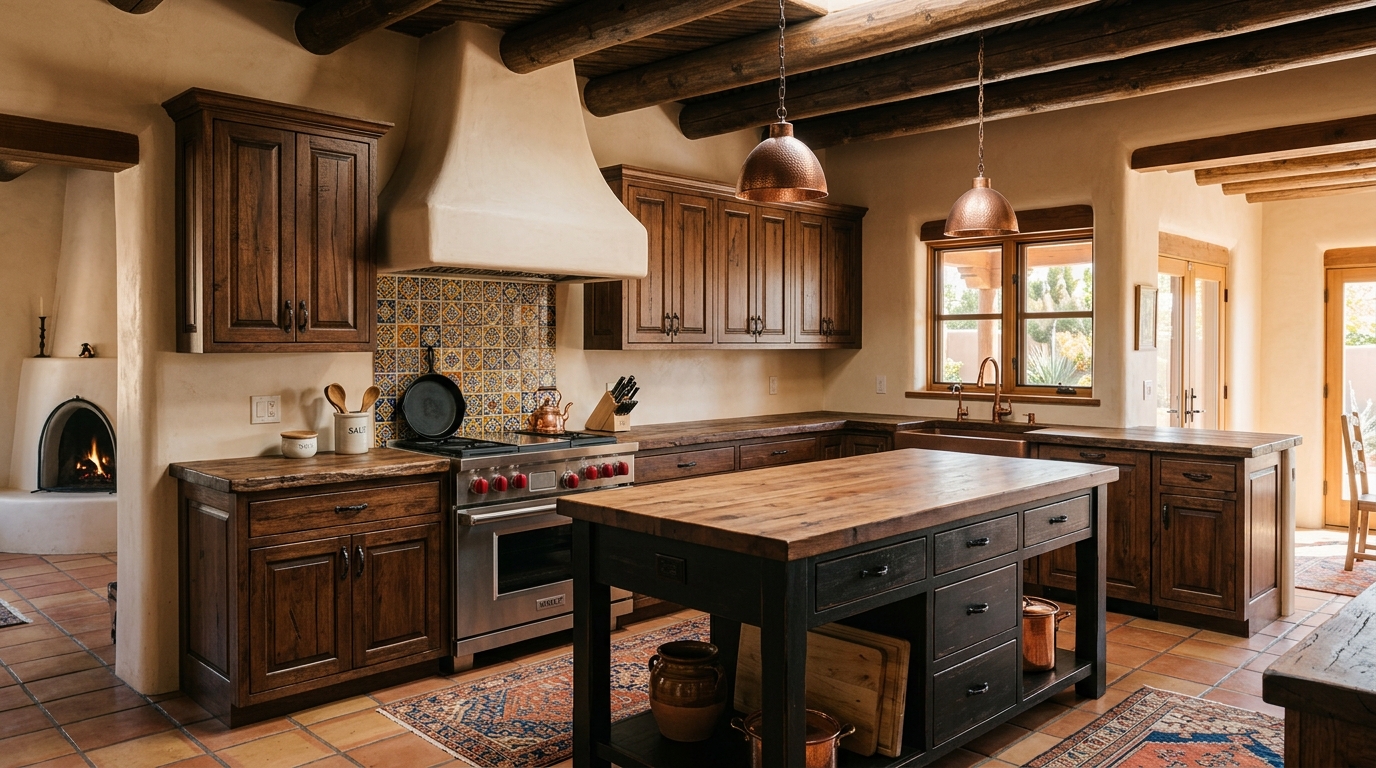 NMNew Mexico NMNew Mexico | 55d | 72% | $41,400 | 79 | Read guide |
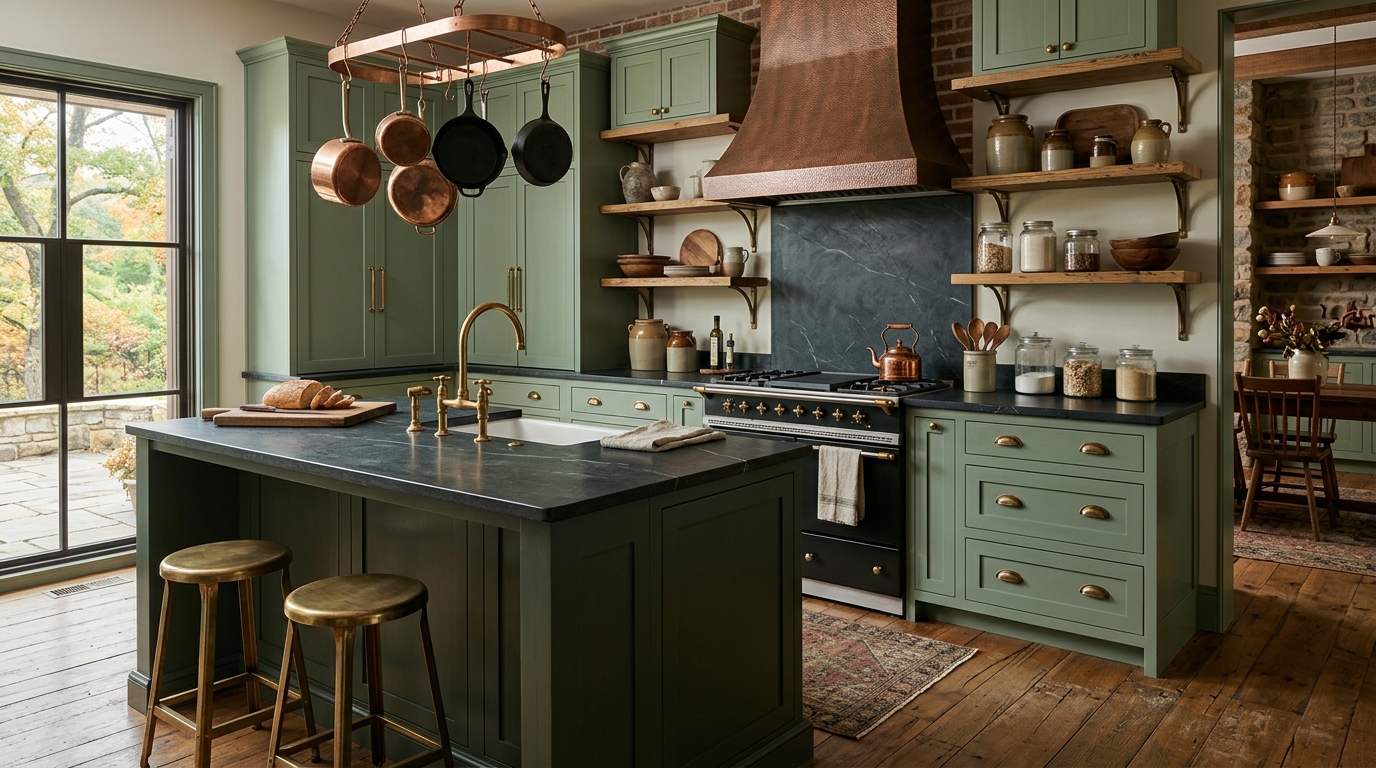 ARArkansas ARArkansas | 60d | 78% | $37,500 | 78 | Read guide |
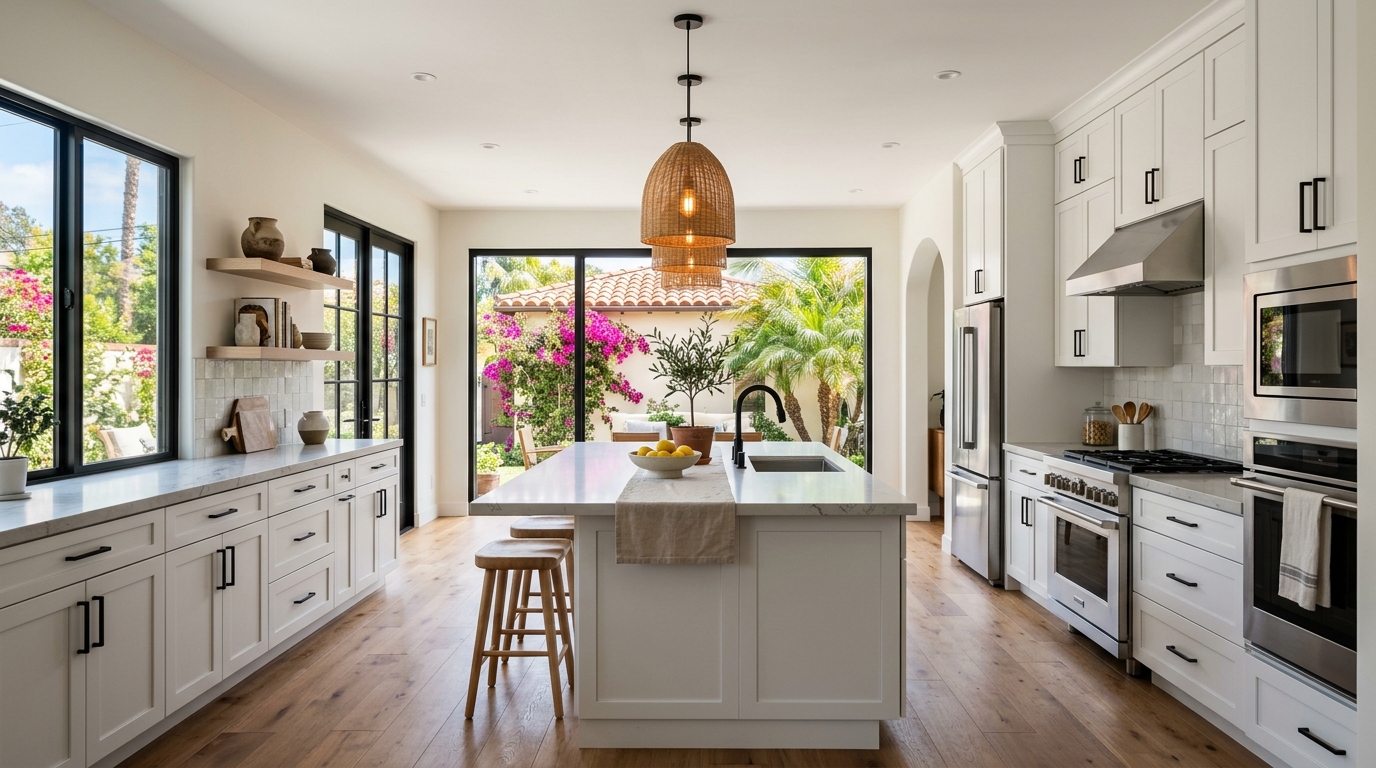 CACalifornia CACalifornia | 40d | 52% | $61,600 | 78 | Read guide |
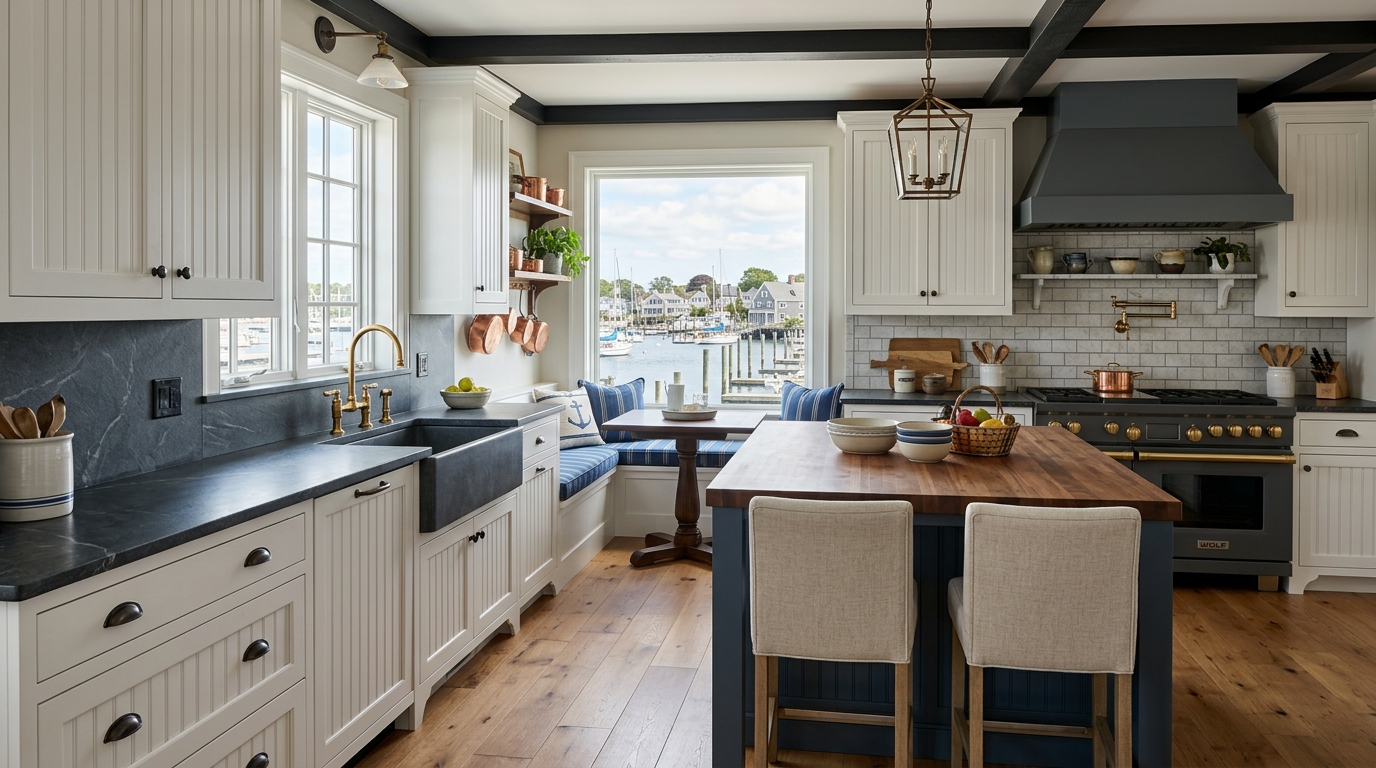 MEMaine MEMaine | 55d | 71% | $49,300 | 77 | Read guide |
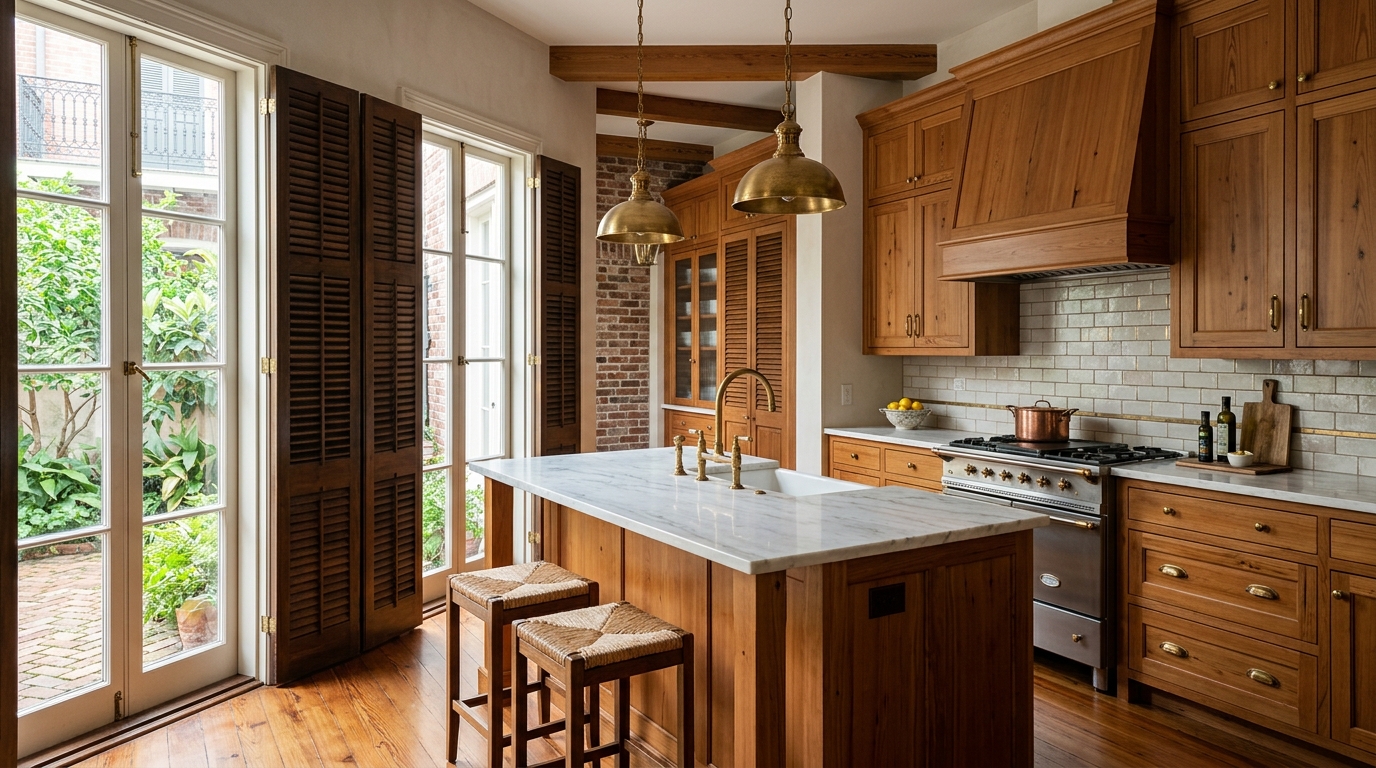 LALouisiana LALouisiana | 60d | 73% | $40,500 | 73 | Read guide |
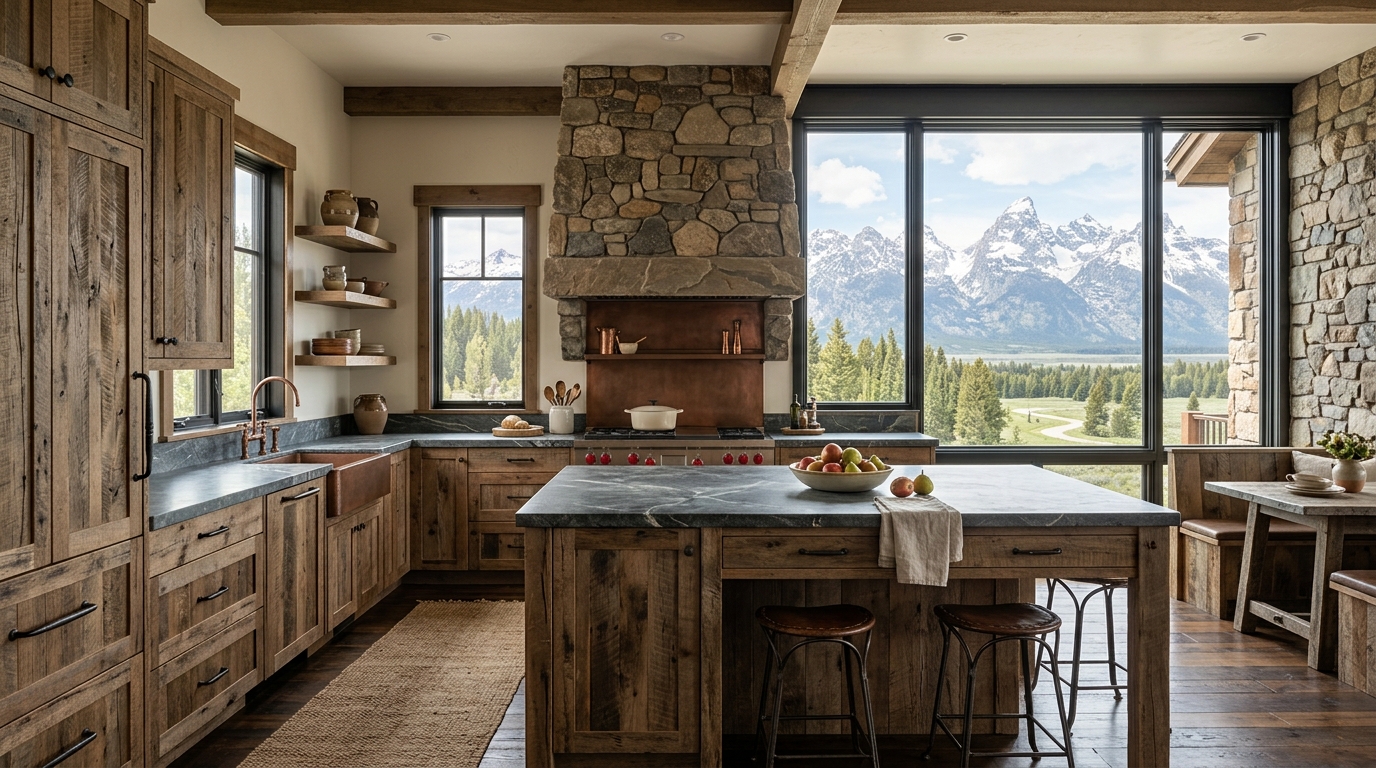 WYWyoming WYWyoming | 60d | 72% | $42,700 | 72 | Read guide |
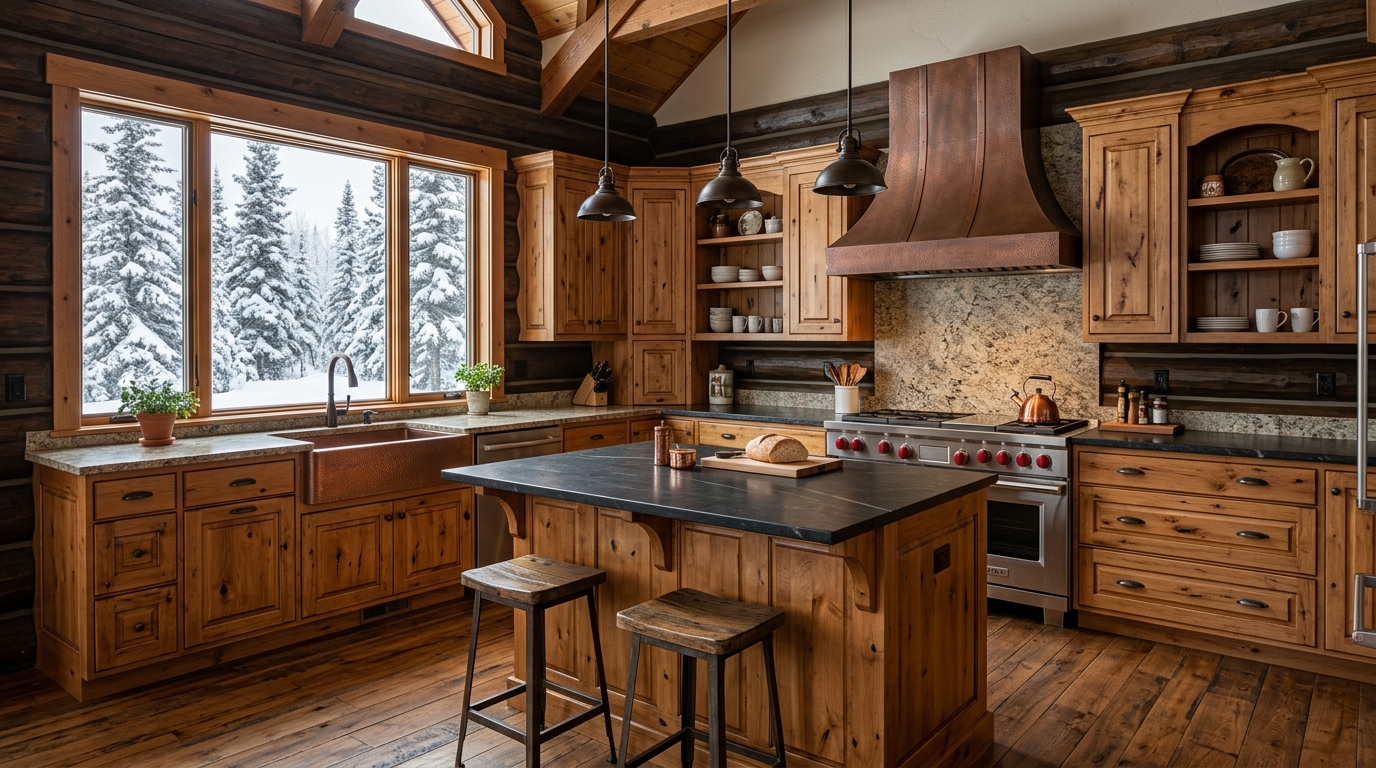 AKAlaska AKAlaska | 60d | 71% | $59,500 | 71 | Read guide |
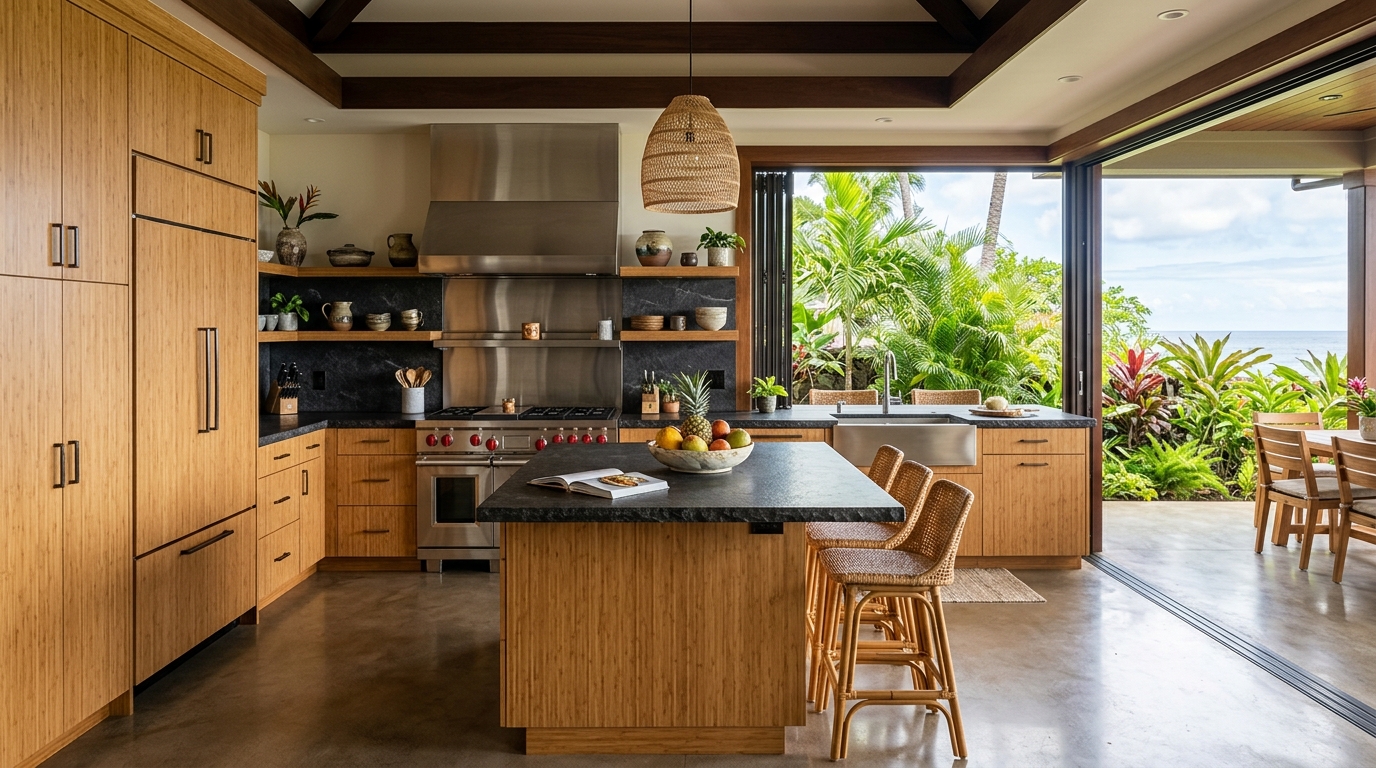 HIHawaii HIHawaii | 45d | 52% | $68,300 | 69 | Read guide |
 MSMississippi MSMississippi | 65d | 75% | $37,000 | 69 | Read guide |
 NYNew York NYNew York | 50d | 56% | $61,600 | 67 | Read guide |
 WVWest Virginia WVWest Virginia | 75d | 73% | $37,500 | 58 | Read guide |
Main atlas
Kitchen cost by state
Full 50-state sortable cost table.
Open atlas
ROI atlas
Best ROI kitchen picks
Pure recoup %, no velocity weighting.
See ROI
DIY atlas
Best DIY-friendly states
Where you can install floors yourself.
See DIY ranking
Which states reward kitchen remodelings fastest at sale?
Top-5 quick-resale states for a 2026 kitchen remodel: Florida (score 164, 30-day median DOM), Texas (score 164, 30-day median DOM), Nevada (score 162, 30-day median DOM), Idaho (score 158, 30-day median DOM), Utah (score 158, 30-day median DOM). These are hot Sunbelt + Mountain West markets where (a) homes turn over fast, and (b) buyers actively reward turn-key kitchen — meaning the upgrade compounds less holding cost AND drives a stronger price premium.
How does kitchen affect days-on-market?
Across the US in 2026, new mid-grade kitchen cuts median days-on-market by an estimated 3-7 days on comparable listings. In a hot 30-day market that's a 10-23% velocity improvement; in a slower 60-day market it's only 5-12%. The velocity premium matters most for flip-house investors paying carrying costs daily — at $40-$60/day in holding cost (mortgage interest, taxes, utilities, insurance), saving 5 days = $200-$300, saving 7 days = $280-$420.
What's the best kitchen scope for a flip house?
IKEA SEKTION cabinets in a white shaker style + quartz remnants + mid-tier appliances wins almost every flip-house comparison: lowest install cost, fastest install timeline (5-7 days for a typical 10×10), and a buyer-friendly aesthetic that doesn't lock the listing into a single taste profile. Custom cabinets add 3-5 weeks to the timeline and rarely justify the extra cost on sub-$500K listings.
Which states should flippers avoid for kitchen ROI?
Slow-velocity markets (West Virginia, Mississippi, Wyoming, Alaska, Maine) deliver both lower ROI multipliers AND longer days-on-market, so the kitchen investment compounds negative carrying costs. In these markets, the higher-leverage move is usually cabinet paint + new hardware + countertop swap (much lower absolute spend, equivalent perceived-quality boost).
How is the quick-resale score calculated?
quickResaleScore = roiPct × min(60 / medianDOM, 2.0) × 100. We take the state's projected kitchen ROI (from the ROI atlas), multiply by a velocity premium (60-day baseline ÷ actual median DOM, capped at 2.0× to keep ultra-hot markets from distorting), and scale to a 0-200 index. A score above 100 means the state's velocity is materially helping the kitchen investment; below 80 means the slow market is dragging it down.